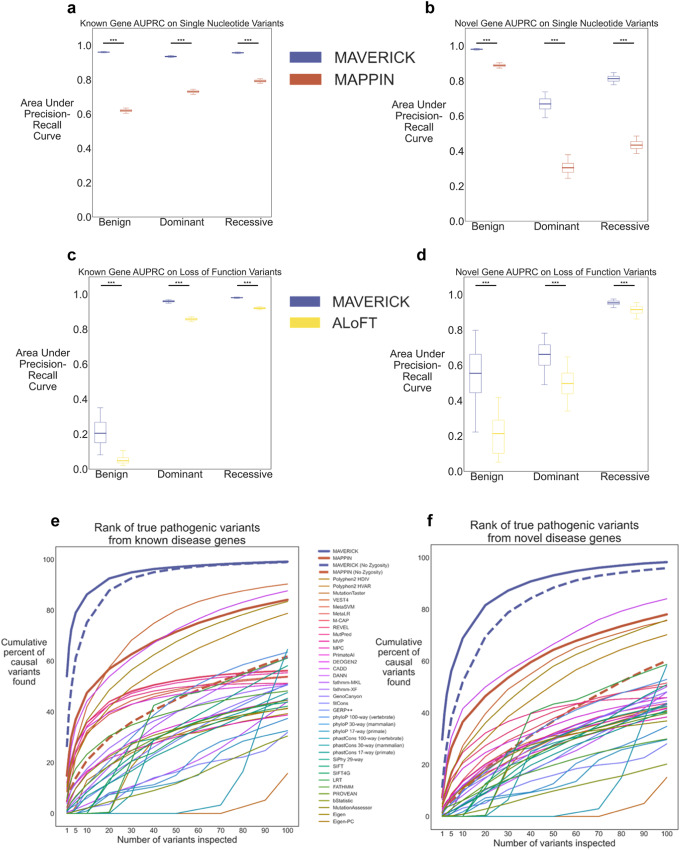
Fig. 4. MAVERICK outperforms similar pathogenicity predictors.
a, b Box plots of areas under the precision-recall curve for MAVERICK and MAPPIN missense, stop-gain and stop-loss single nucleotide variants. a Performance for the known genes test set. b Performance for the novel genes test set. c, d Box plots of areas under the precision-recall curve for MAVERICK and ALoFT loss-of-function variants. c Performance for the known genes test set. d Performance for the novel genes test set. In panels a–d, *** indicates p-value < 0.001 in one-sided Mann–Whitney U test based on bootstrapping (n = 1000 iterations). Multiple testing corrections were not performed. Box plot elements in panels a–d show the median as the center line, the 25th and 75th percentiles as limits of the boxes, and the 5th and 95th percentiles as the limits of the whiskers. Outliers are not plotted. e, f Line plot of cumulative proportion of cases solved by pathogenicity classifiers when rank ordering variants using only genotype information in SNV-only subset of the spike-in variant prioritization task shown in Fig. 3b. Dashed lines for MAVERICK and MAPPIN show their performance when dominant and recessive scores are summed to give a pathogenicity prediction which does not consider variant zygosity. e Performance for the known genes test set. f Performance for the novel genes test set.

