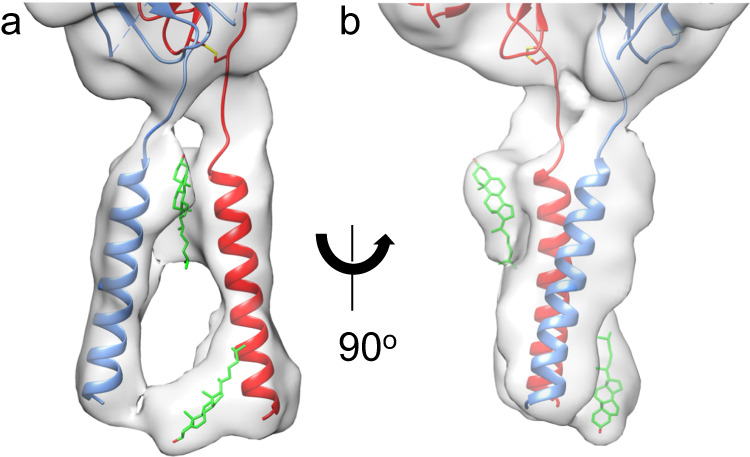
Fig. 2. Structure of TM domains with bound lipids of the inactive full-length αIIbβ3.

a Closeup view of the TM region of the cryo-EM map in the same orientation as in Fig. 1a. b a 90o rotation of the orientation in a. The map has been subjected to a low pass filter at 7.0 Å to correspond to the local resolution of this region. The filtered map shows clear densities for both αIIb (light blue) and β3 (red) TM α-helices. The current resolution does not allow the assignment of side chains for the TM helices with confidence. Alignment with the NMR structure (2K9J.pdb) suggests that the αIIb and β3 TM α-helices end in the new structure at G991 and L718, respectively. The additional densities in the map have been modeled as cholesterol molecules (carbons in green, oxygen in red) at the outer and inner membrane leaflets.
