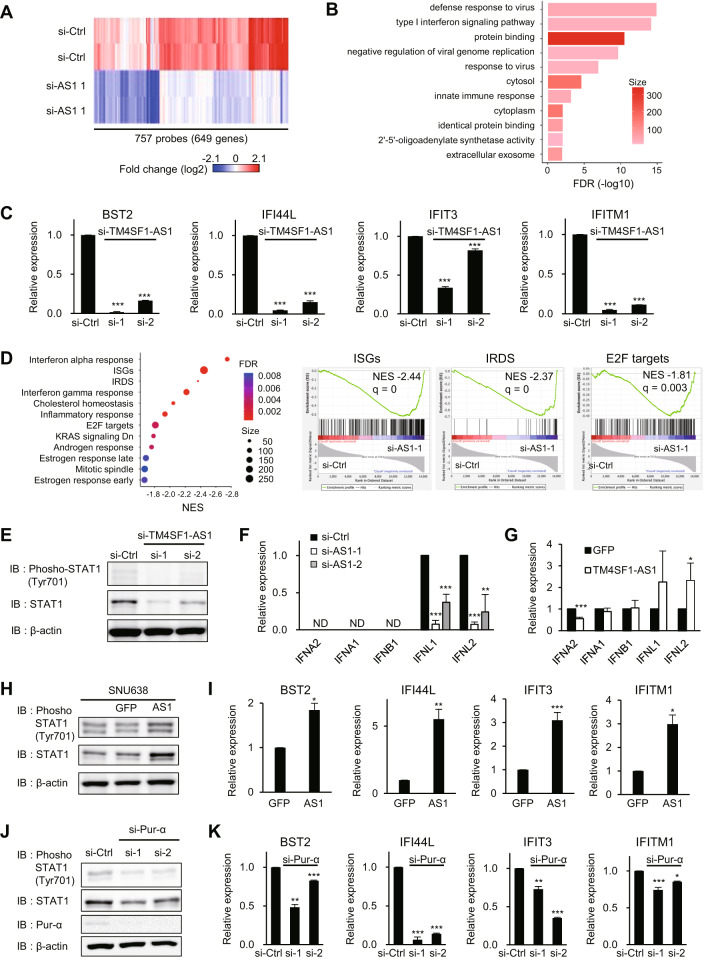
Fig. 4. TM4SF1-AS1 activates interferon signaling in GC cells.
A Heatmap showing expression of genes suppressed by TM4SF1-AS1 knockdown in HSC-45 cells. B GO analysis using the genes in A. C qRT-PCR analysis of representative IRDS genes in HSC-45 cells transfected with the indicated siRNAs. (n = 3). D GSEA analysis using the microarray data. Gene sets with an FDR < 0.01 are shown on the left. Enrichment plots of indicated gene sets are shown on the right. E Western blot analysis of total and phosphorylated STAT1 in HSC-45 cells transfected with the indicated siRNAs. (F, G) qRT-PCR analysis of interferon genes in HSC-45 cells transfected with the indicated siRNAs (F) or in SNU638 cells stably transfected with the indicated genes (G). (n = 3). H Western blot analysis of total and phosphorylated STAT1 in SNU638, SNU638-GFP, and SNU638-TM4SF1-AS1 cells. I qRT-PCR analysis of IRDS genes in SNU638-GFP and SNU638-TM4SF1-AS1 cells. (n = 3). J Western blot analysis of STAT1 and Pur-α in SNU638-TM4SF1-AS1 cells transfected with the indicated siRNAs targeting Pur-α. K qRT-PCR analysis of IRDS genes in SNU638-TM4SF1-AS1 cells transfected with the indicated siRNAs. (n = 3). *P < 0.05, **P < 0.01, ***P < 0.001.

