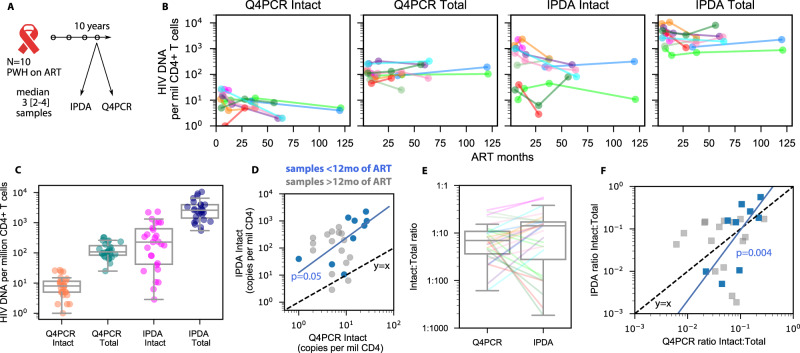
Fig. 1. Comparison of reservoir size and half-lives using two intact HIV reservoir assays.
A Study schematic. B Longitudinal HIV DNA levels using 2 assays from 10 PWH for intact and total HIV DNA. C HIV DNA levels for each assay and proviral category grouped over all n = 35 longitudinal time points. Box plots indicate median (center line), interquartile range (box), and 1.5x interquartile range (whiskers). D Head-to-head comparison of intact levels measured by both assays. Blue and gray dots indicate samples taken before and after 1 year of ART, respectively. Dashed black line indicates the line y = x. Blue line indicates the slope of early time points, which was significantly correlated (1 sided Spearman p = 0.05). E Ratio of intact to total HIV DNA for both assays over all n = 35 longitudinal time points from N = 10 PWH. Box plots indicate median (center line), interquartile range (box), and 1.5x interquartile range (whiskers). F Head-to-head comparison of intact:total ratios measured by both assays. Blue and gray dots indicate samples taken before and after 1 year of ART, respectively. Dashed black line indicates the line y = x. Blue line indicates the slope of early time points, which was significantly correlated (1 sided Spearman p = 0.004).

