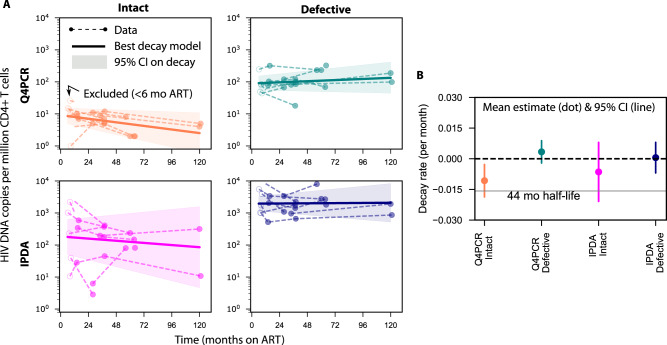
Fig. 2. Estimated reservoir decay from two HIV DNA assays.
A Log-linear mixed effects model estimates the average decay (solid line) with confidence band (shaded area) fitted to longitudinal samples from PWH on ART (dots and dashed lines, open dots indicate excluded time points before 6 months). B Average (dot) and confidence interval (vertical line) for the estimated decay rate of each assay and proviral category from N = 10 PWH. Decay rates are used to allow for zero or positive values (growing population and infinite half-life). A benchmark 44 month half-life is included to contextualize decay rates.

