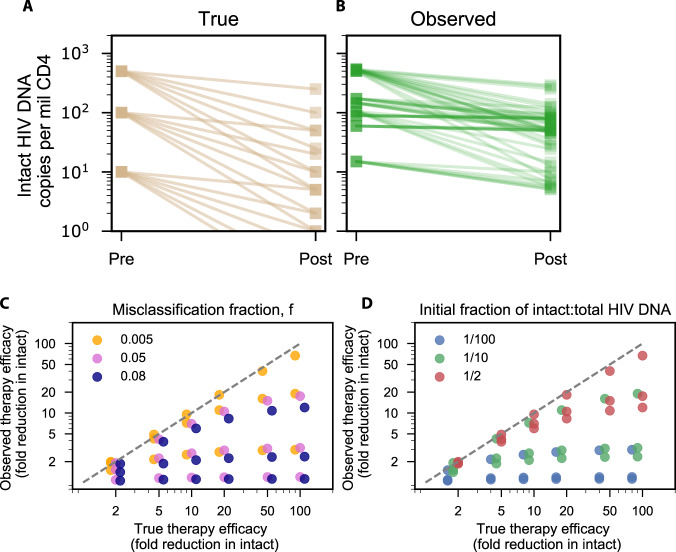
Fig. 5. Underestimation of therapeutic efficacy occurs with high true efficacy, high misclassification, and low initial intact fractions.
Simulated true (A) vs observed (B) reduction in intact HIV DNA after therapies with 6 different efficacies each ranging from 2-fold to 100-fold reduction in intact proviruses (no reduction of defective proviruses) applied to reservoirs with 3 different initial intact fractions, for a total of 18 simulations. C True therapeutic efficacy vs observed therapeutic efficacy for the range of therapies, colored by misclassification fraction ranging from 0.5 to 8%. There are 3 dots of each color, for each x-value, representing the variability from the initial fraction. D True therapeutic efficacy vs observed therapeutic efficacy for the range of therapies, colored by initial fraction of intact to total HIV DNA ranging from 1/100 to 1/2. There are 3 dots of each color, for each x-value, representing the variability from the misclassification fraction.

