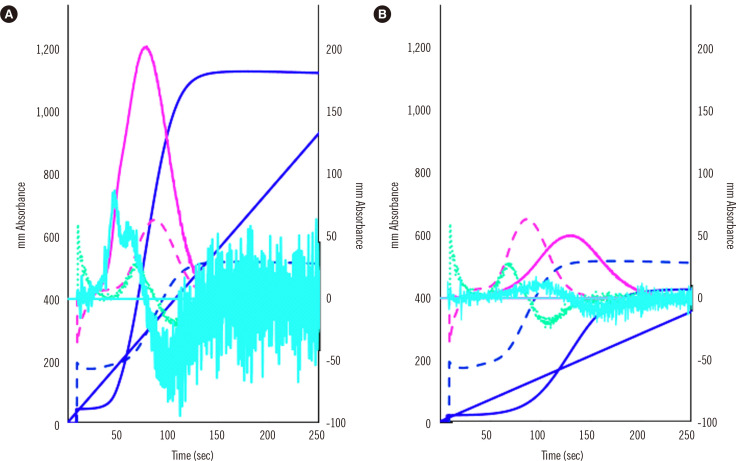
Fig. 4.
CWA-sTF/FIXa of a patient with a neoplasm and acute cerebral infarction (A) and a patient with thrombocytopenia due to aplastic anemia (B). The fibrin formation curve is indicated in dark blue, the 1st DC (velocity) in pink, and the 2nd DC (acceleration) in light blue. The solid line represents a patient sample, and the dotted line represents a sample from a healthy volunteer. The peak heights of the three curves were significantly higher for patient (A) than for the healthy volunteer and significantly lower for patient (B) than for the healthy volunteer.
Abbreviations: CWA, clot waveform analysis; DC, derivative curve; sTF/FIXa, small amount of tissue factor-induced clotting factor IX activation.

