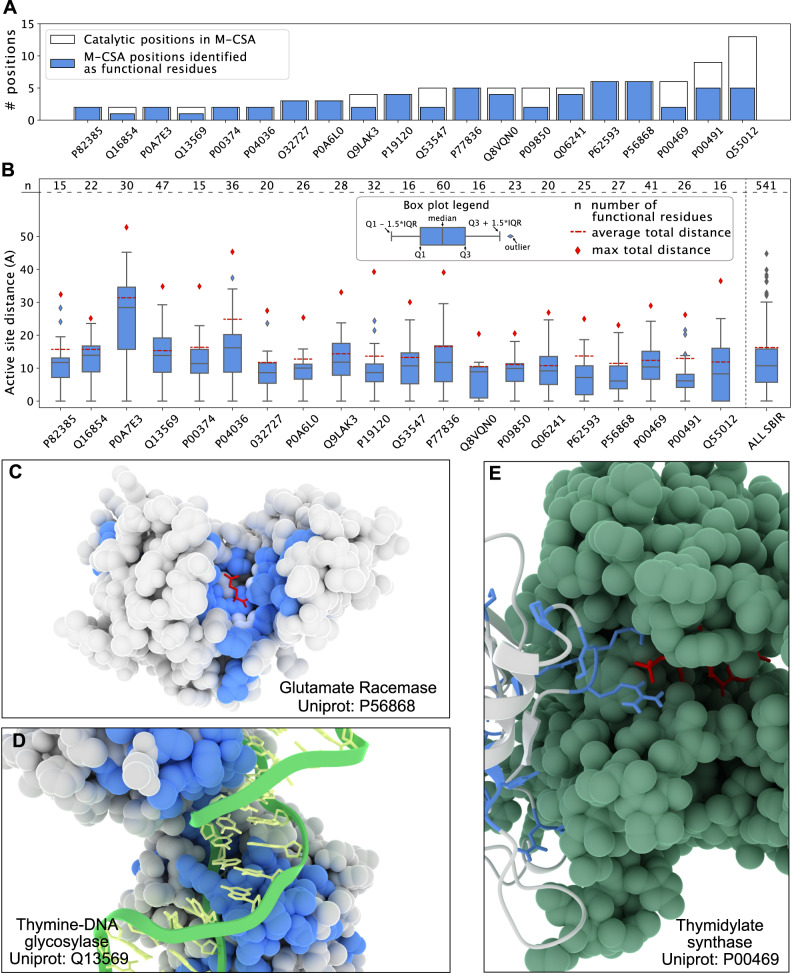
Fig. 4. Predicting functional sites in enzymes.
We used our model to study functional residues in a set of 20 enzymes from M-CSA, which also provides annotations of residues in catalytic sites. A Number of known catalytic residues for each protein in M-CSA (white) and the number of these catalytic residues classified as functional positions by our model (blue). B Functional sites are generally close to the active site. For each protein, we show the distribution of distances (using a boxplot) between the predicted functional sites and the (nearest) active site residue (from M-CSA) with the total number of functional residues reported (as n) in the top of the distribution. For comparison we show the average and maximum pairwise residue-residue distances (red dotted line and a red squared dot, respectively). The rightmost boxplot shows the cumulative data. The composition of each boxplot (boundaries and elements) is reported in the Figure legend. C–E Examples of predicted functional sites (blue) in three proteins from the M-CSA set. C Functional sites in glutamate racemase are found in a single cluster close to the active site (substrate in red). D Functional sites in thymine-DNA glycosylase are both located in the active site, but also in the region needed to bind the target DNA chain (green and yellow structure). E Predicted functional sites are also found in protein–protein interfaces, such as in the interface of homo-dimeric thymidylate synthase. The second dimeric sub-unit is coloured in green with the substrate in the active site in red.

