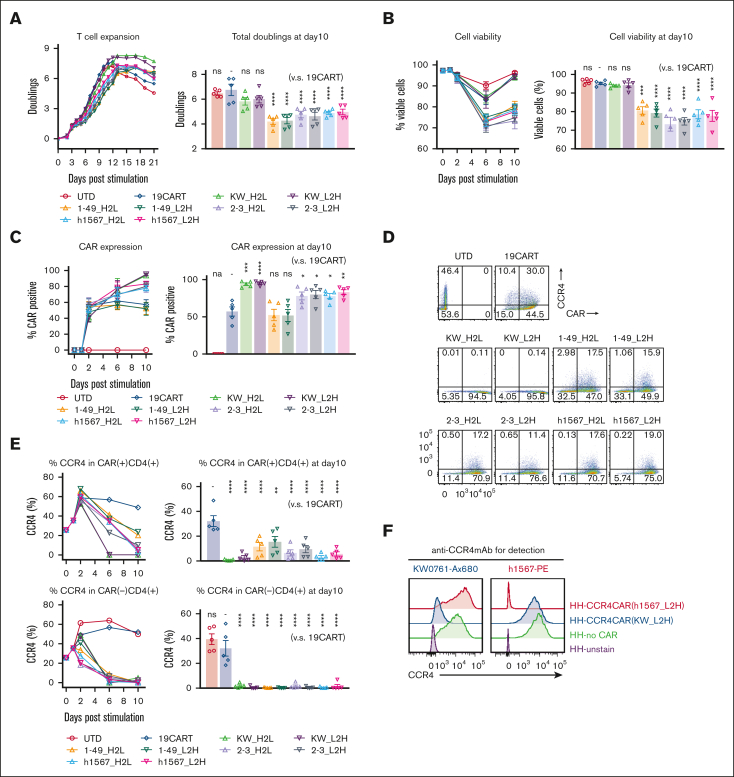
Figure 1.
CCR4-CAR T cells can expand while depleting CCR4-expressing T cells. (A) Expansion of T cells transduced with CCR4-CAR for 21 days (left panel) and total doublings at day 10 (right panel). The left panel shows representative T-cell expansion curves. T cells were counted and diluted to 0.7 × 10⁶ cells/mL by adding fresh media every other day. T cells were harvested when the T-cell size decreased to 350 μm3 for subsequent experiments when a part of the cells was spared to continue counting. The right panel shows the pooled data of total T-cell expansion on day 10 after anti-CD3/28 stimulation. Dots and bars represent individual data from each donor and the standard error of the mean (SEM) (5 experiments from 5 donors). (B) Time course analysis of T-cell viability. Cell viability was analyzed by amine-reactive dye staining (LIVE-DEAD staining) and FCM. Dots and bars represent individual data from each donor and SEM image (right panel). Dots and bars represent individual data from each donor and SEM image (left panel) (5 experiments from 5 donors). Statistical analysis was performed to the data obtained on day 10. (C) Time course analysis of CAR expression in T cells showing CAR-positive cell expansion in some types of CAR T cells. Dots and bars represent individual data from each donor and SEM (right panel). Dots and bars represent individual data from each donor and SEM (left panel) (5 experiments from 5 donors). Statistical analysis was performed to the data obtained on day 10. (D) Representative flow plots showing the expression of CAR and CCR4 on T cells on day 6 after stimulation. The numbers denote the percentage of cells in each quadrant. (E) Representative kinetics of CCR4 expression (left panels) and pooled data of CCR4 expression on day 10 (right panel). Dots and bars represent individual data from each donor and SEM (5 experiments with 5 donors). (F) Epitope-specific blocking of CCR4 by CCR4-CAR in HH cells. CCR4 expression detected either with anti-CCR4mAb clone h1567 (left panel) or anti-CCR4 mAb clone KW-0761 (right panel) in HH cells transduced with the indicated CCR4 CAR is shown. ∗P < .05; ∗∗P < .01; ∗∗∗P < .001; ∗∗∗∗P < .0001; ns, not significant (vs CD19CART group) using 1-way analysis of variance (ANOVA) with Tukey’s post hoc test.

