Figure 2.
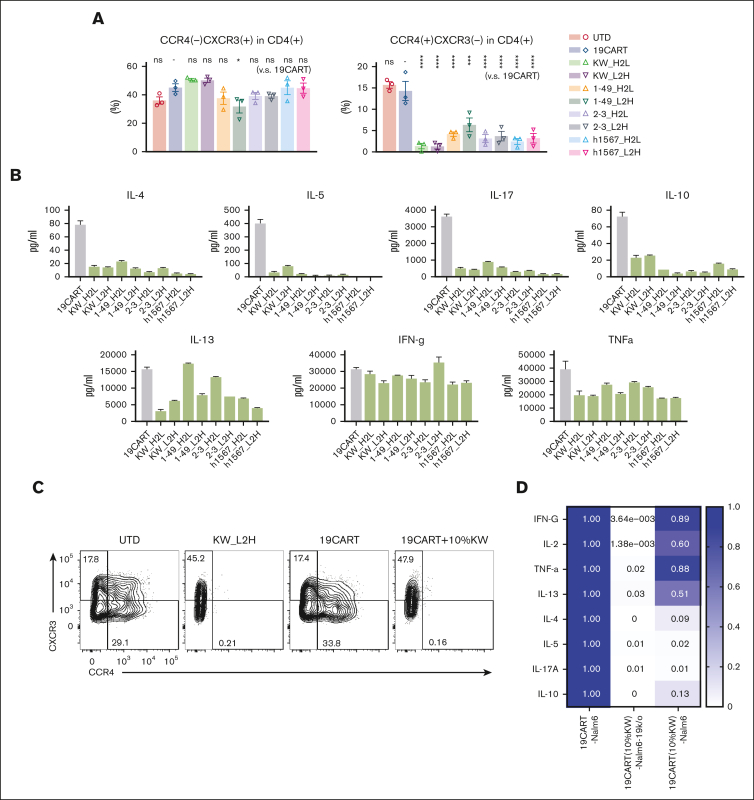
Fratricide changes the Th-subset proportion with decreased Th2, Th17, and Treg cytokine production while sparing Th1 cytokine production. (A) Chemokine receptor expression profiles of CAR T-cell products. The Th1-like subset was defined as CD4(+), CXCR3(+), CCR4(–), CCR6(–), and CCR10(–). Th2-like subset was defined as CD4(+), CXCR3(–), CCR4(+), CCR6(–), and CCR10(–) by FCM. Phenotypes were analyzed by gating the CAR-positive population, with the exception of the UTD group. Dots and bars represent individual data from each donor and SEM (3 experiments from 3 donors). ∗∗∗P < .001; ∗∗∗∗P < .0001; ns, not significant (vs CD19-CAR T group) by 1-way ANOVA with Tukey’s post hoc test. (B) Profiles of cytokine production by CD19- and CCR4-CAR T cells. CAR T cells were stimulated with PMA/Iono. Cytokine levels in the supernatant 24 hours after stimulation were analyzed using the LUMINEX assay. Data are representative of 3 experiments from 3 donors. Bars represent the mean and standard deviation of technical duplicates. (C) Depletion of CCR4-positive subsets by adding CCR4-CAR T cells to CD19-CAR T cells. T cells were stimulated and transduced with either the CCR4 CAR or CD19 CAR. 10% CCR4-CAR T cells were mixed with CD19-CAR T cells 5 days after stimulation. CCR4 expression in CD19-CAR–positive cells was analyzed on day 10. The numbers denote the percentage of cells in each quadrant. Data are representative of 3 experiments from 3 donors. (D) Heat map of Th-related cytokine production by CD19-CAR T cells pretreated with CCR4-CAR T cells compared with untreated CD19-CAR T cells. CAR T cells were stimulated using the indicated stimulators. The cytokine levels in the supernatant at 24 hours after stimulation were analyzed using LUMINEX assay. The cytokine levels from untreated CD19-CAR T cells were set to 1 and the relative expression levels are indicated. Data are representative of 3 experiments from 3 donors.

