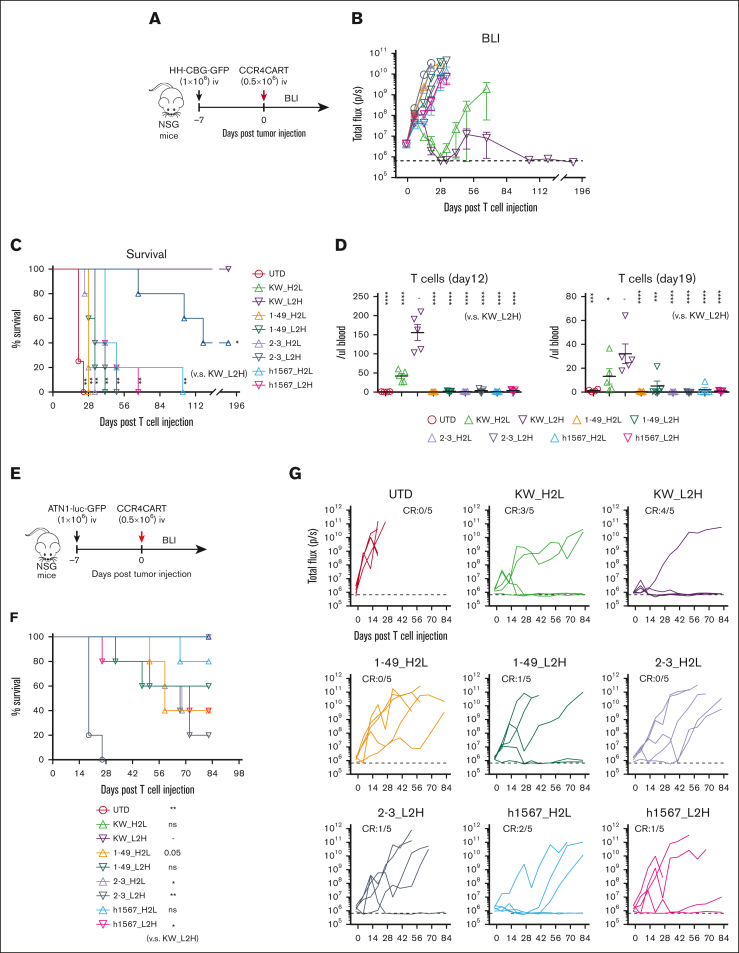
Figure 4.
CCR4-CAR (KW_L2H) cures ATN-1 and HH cell xenograft mice and induces superior T-cell engraftment. (A) Schematic representation of the experiment. NSG mice were intravenously inoculated with 1 × 10⁶ HH cells expressing the click beetle luciferase (HH-CGB-GFP). Engrafted tumors were intravenously treated with either 0.5 × 10⁶ CCR4-CAR–positive T cells or untransduced T cells 7 days after tumor cell inoculation. (B) Overall kinetics of tumor burden by BLI. The dashed line represents the background level of photons determined by imaging tumor-free mice. Dots and bars represent the mean and SEM (n = 4 for the UTD group and n = 5 for the other groups). (C) Survival curve obtained using the Kaplan-Meier method. ∗P < .05; ∗∗P < .01; ns, not significant (vs KW_L2H group) using the log-rank test. (D) T-cell count of peripheral blood on days 12 and 19 by FCM. ∗P < .05; ∗∗P < .01; ∗∗∗P < .001; ∗∗∗∗P < .0001. (E) Schematic representation of the experiment. The NSG mice were intravenously inoculated with 1 × 10⁶ ATN-1 cells expressing firefly luciferase (ATN1-luc-GFP). Engrafted tumors were intravenously treated with either 0.5 × 10⁶ CCR4-CAR–positive T cells or untransduced T cells 7 days after tumor cell inoculation. (F) Survival curve using the Kaplan-Meier method. ∗P < .05; ∗∗P < .01; ns, not significant (vs KW_L2H group) using the log-rank test. (G) Kinetics of tumor burden using BLI. The dashed line represents the background level of photons determined by imaging tumor-free mice. The lines indicate the individual data from each mouse.

