Figure 1.
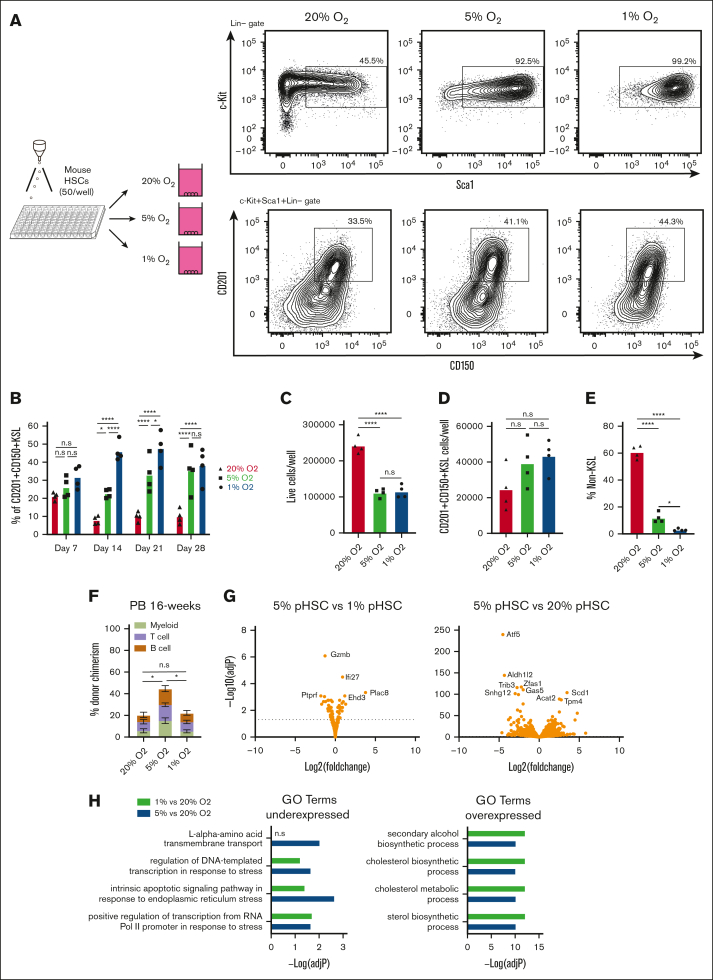
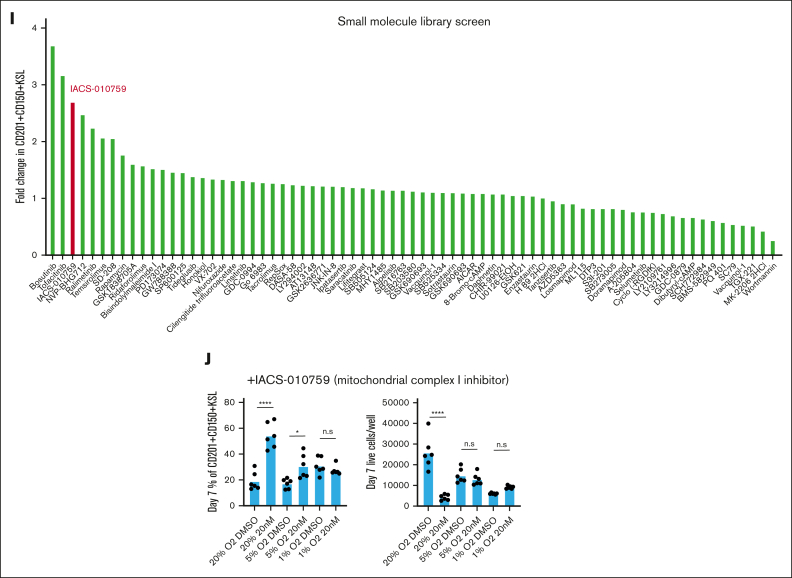
Improved stability of PVA-based HSC cultures at low O2 concentrations. (A) Schematic diagram of low O2 HSC cultures (left). Mouse CD150+CD34-KSL HSCs were sorted into PVA-based media in 96-well plates (50 cells per well) in 200 μL of media and were cultured for 4 weeks at 20%, 5%, or 1% O2. Representative flow cytometry plots of 4-week HSC-derived cultures (right). c-Kit and Sca1 expression within the lineage– cell fraction (top), and CD201 and CD150 expression within the KSL cell fraction (bottom). (B) Mean frequency of CD201+CD150+KSL cells within the HSC-derived cultures described in panel A (n = 4). (C) Mean number of live cells per well within HSC-derived cultures described in panel A (n = 4). (D) Mean number of CD201+CD150+KSL cells per well within the HSC-derived cultures as described in panel A (n = 4). (E) Mean number of non-KSL cells per well within the HSC-derived cultures described in panel A (n = 4). (F) 16-week donor peripheral blood (PB) chimerism from 4-week-old HSC-derived cultures incubated at 20%, 5%, or 1% O2. Five thousand cells from each culture were transplanted alongside 1 × 10⁶ WBMCs into lethally irradiated recipients (mean ± standard deviation [SD]; n = 8-9). (G) Differential gene expression analysis between 5% O2 pHSC and 1% O2 pHSC samples (left) and between 5% O2 pHSC and 20% O2 pHSC samples (right). Results are displayed as Log2 (fold change) vs –Log (adjusted P value). (H) Gene Ontology (GO) term enrichment analysis for underexpressed and overexpressed genes in the 5% O2 and 20% O2 pHSC samples. (I) Fold change in CD201+CD150+KSL cells relative to control well after a 7-day culture with the indicated compounds at 20% O2. Of the 116 compounds tested, only 74 that supported cell survival/growth are displayed (see supplemental Table 1 for a full list of the compounds). Cell cultures were initiated with 50 CD201+CD150+KSL cells from 3-week HSC cultures. The mean of the 4 wells (from 2 biological replicates) is displayed. (J) Mean frequency of CD201+CD150+KSL cells (left) and mean number of live cells per well (left) within 7-day HSC-derived cultures at 20% O2, 5% O2, or 1% O2, cultured with either dimethyl sulfoxide or the mitochondrial complex I inhibitor IACS-01-759 (20 nM; n = 6). Statistical analysis was performed using analysis of variance (ANOVA). ∗P < .05; ∗∗∗∗P < .0001. n.s., not significant; RNA Pol II, RNA polymerase II.


