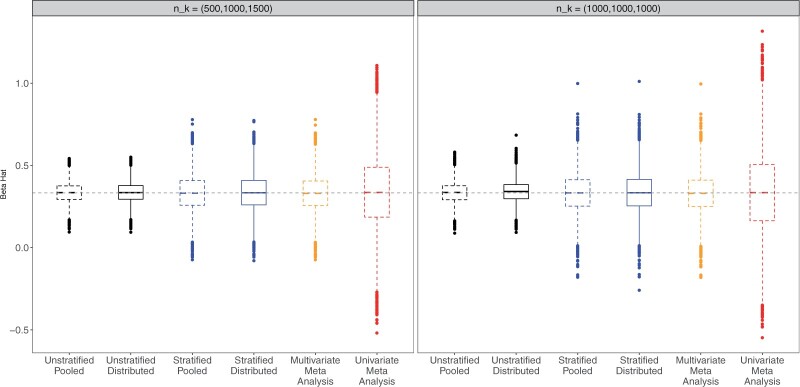
Fig. 1.
Boxplot of the estimates using distributed Cox regression, pooled Cox regression, and meta-analyses with simulated data of sample size  with data generated from unstratified models. Sizes for the data-contributing sites are
  (left plot) or
  (right plot). Covariates distributions for all the data-contributing sites are different. True log HR value is
  . Number of replications = 10 000.

