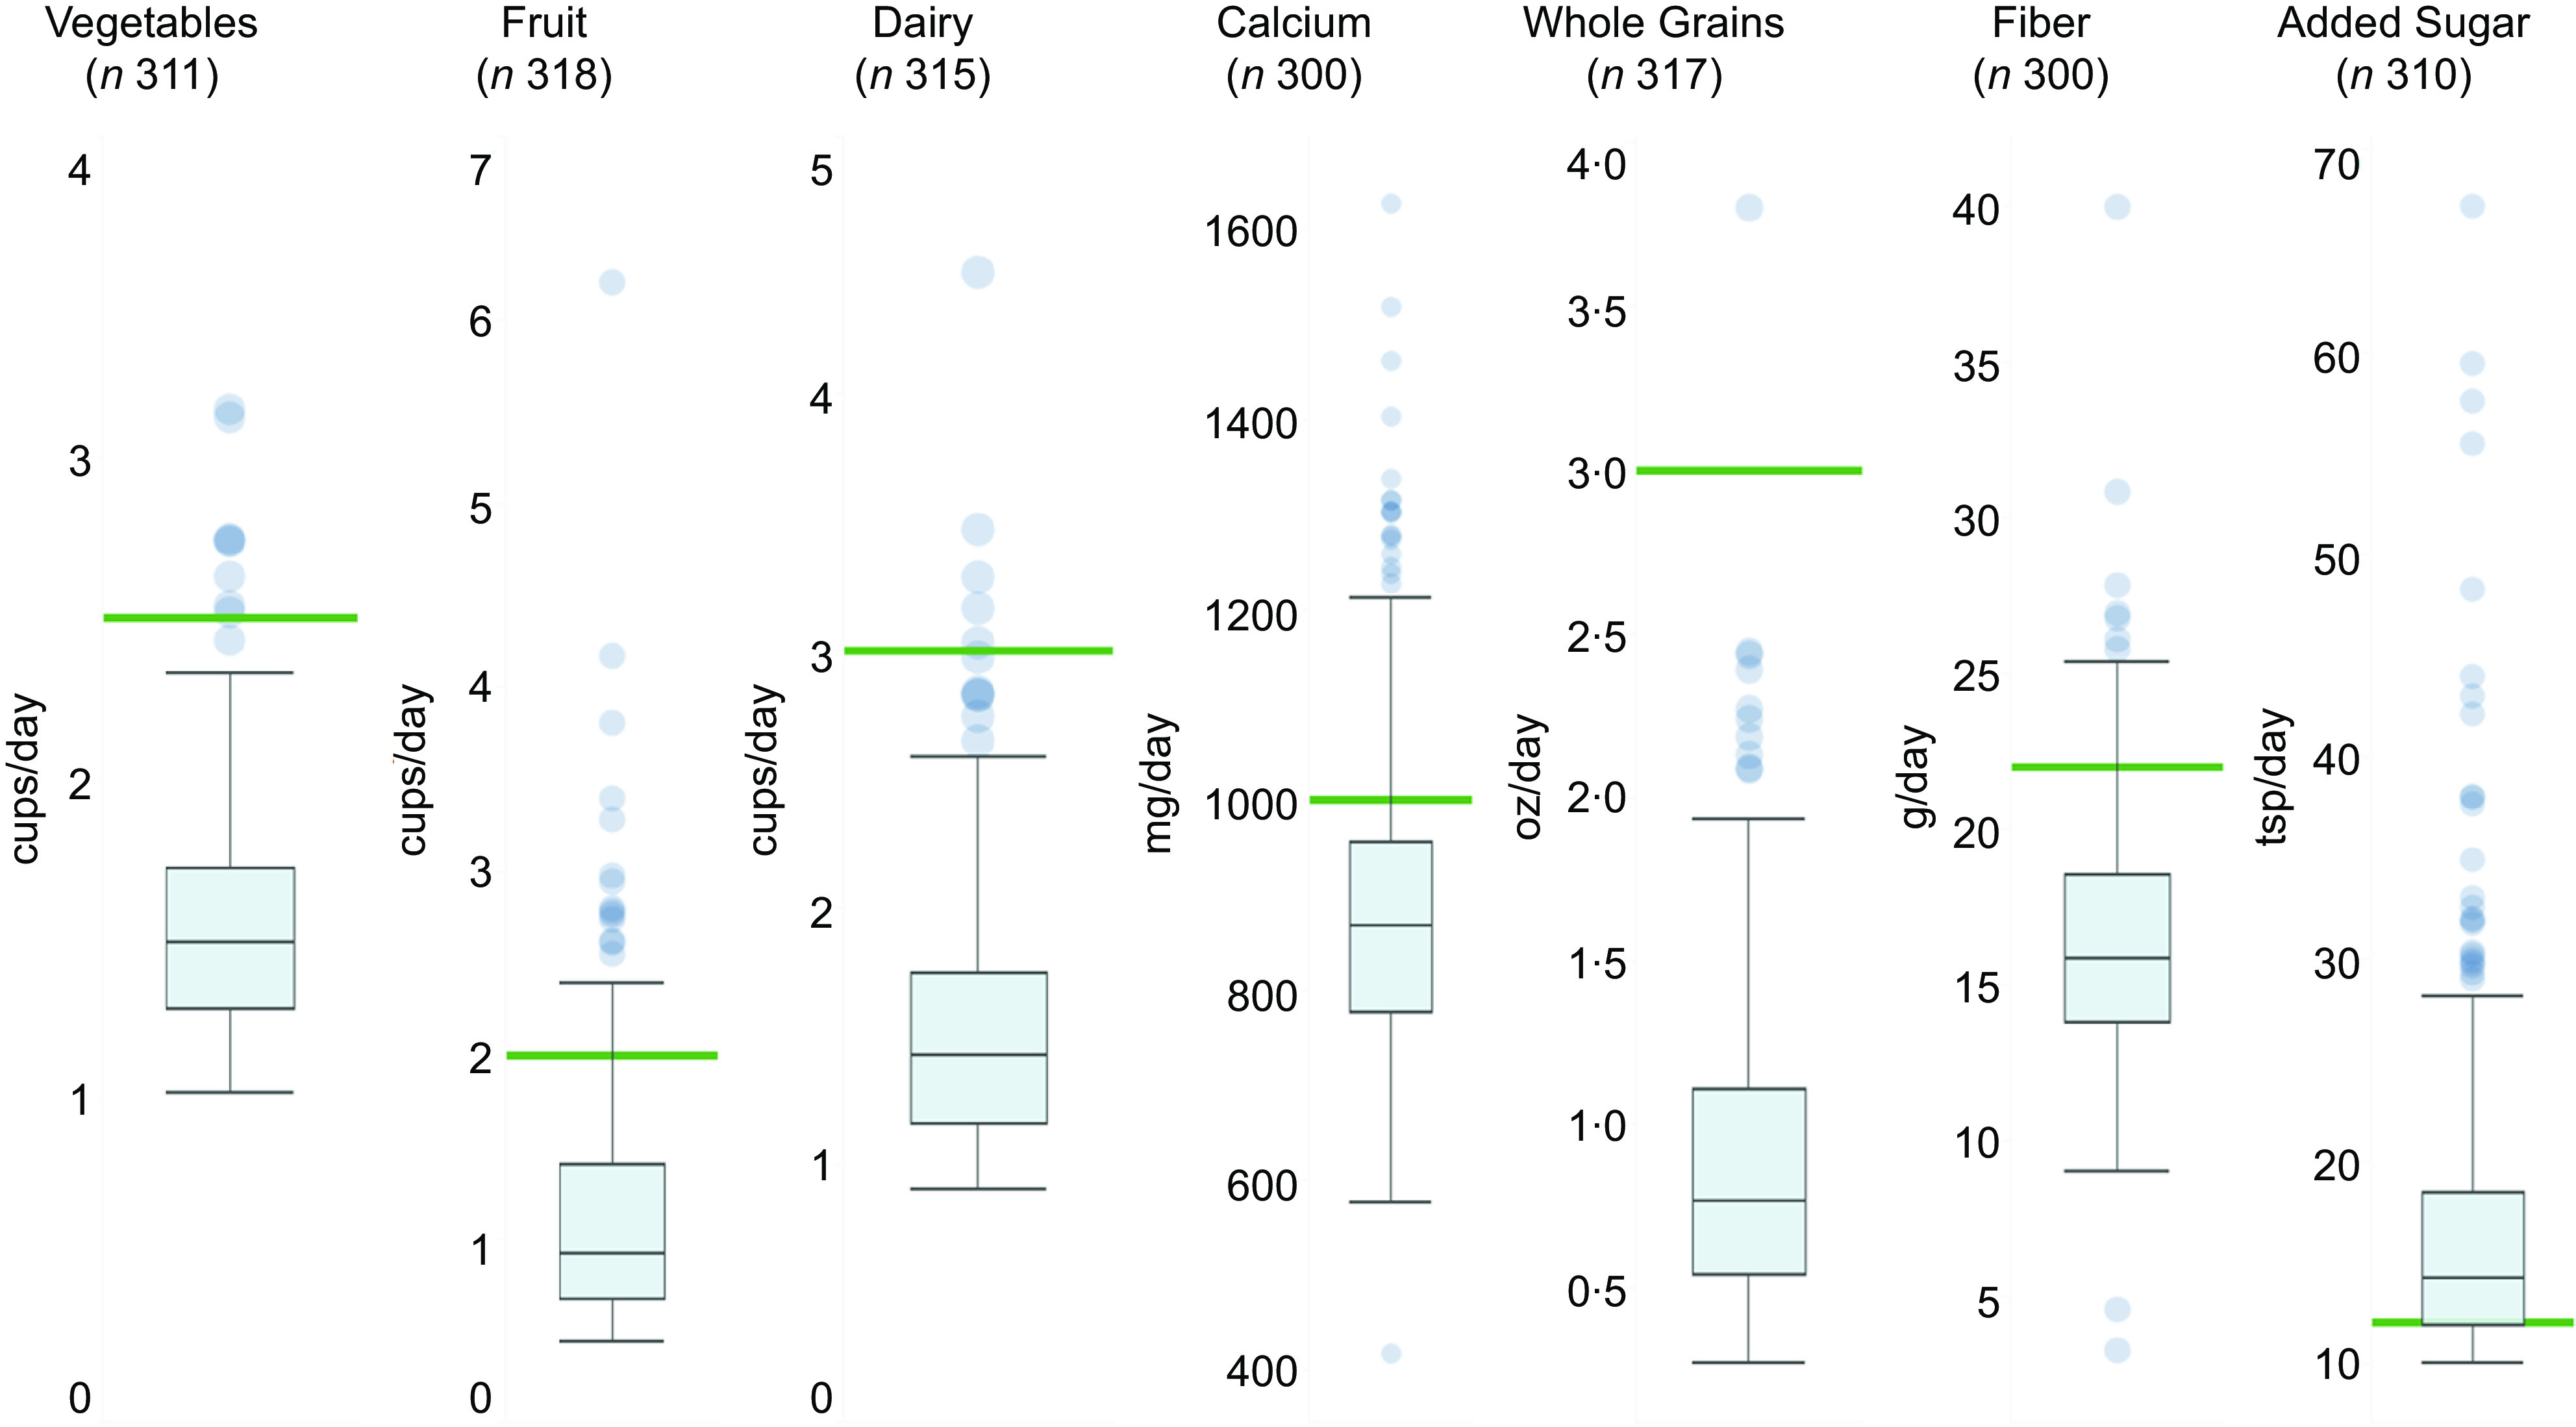
Fig. 1.

Distribution of daily dietary intake among participants. For each dietary intake category, intake amount was calculated for all participants with complete data. The box and whisker plots illustrate the median, 25th and 75th percentiles, and outliers of dietary intake categories. The green bar represents the minimum recommended intake for vegetables, fruit, fibre, whole grains, dairy products and Ca as well as the maximum recommended intake for added sugar, according to the Dietary Guidelines for Americans, 2020–2025(11).
