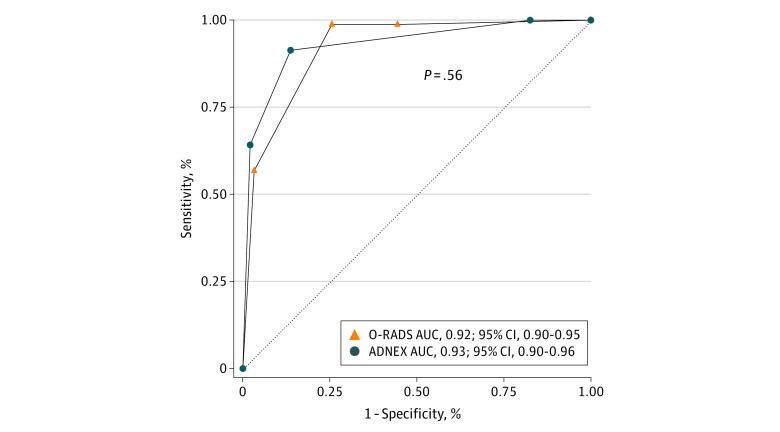
Figure 3. Receiver Operating Characteristic (ROC) Curves for the Diagnostic Performance of Ovarian-Adnexal Reporting and Data System (O-RADS) and Assessment of Different Neoplasias in the Adnexa (ADNEX) Models Using Discrete Ordinal Categories.
The O-RADS model classifies each lesion into 1 of 6 risk categories with a score of 0 to 5: 0 for incomplete evaluation and 1 for normal ovary including physiologic cyst; hence, the ROC curve analysis shown includes O-RADS risk scores of 2 to 5 (ordinal categories that correlate with 0%-100% risk of malignant tumor). Converting the ADNEX continuous personalized risk of malignant tumor (0%-100%) into discrete ordinal categories as defined by the O-RADS model (scores 2-5) resulted in a reduced overall diagnostic performance of the ADNEX model; the area under the curve (AUC) decreased from 0.96 to 0.93, which was similar to the O-RADS model performance (AUC, 0.92; P = .56).

