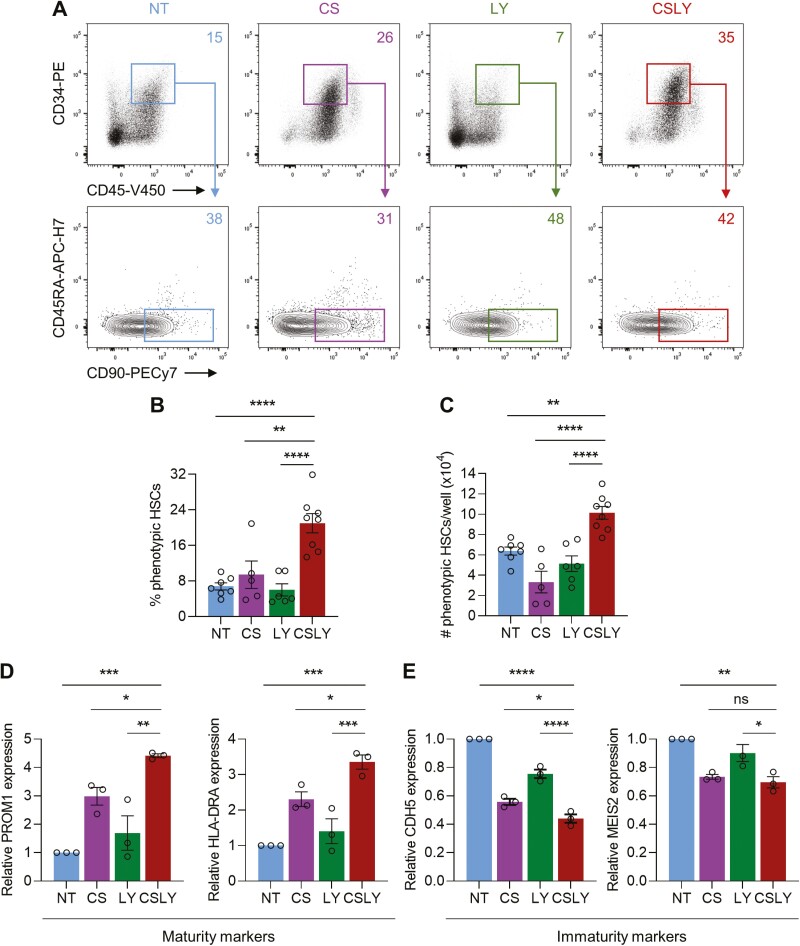
Figure 4.
Modulation of WNT, Activin/Nodal, and MAPK signaling pathways during human iPSC differentiation enhances formation of HSPCs with phenotypic and molecular attributes of maturation. Human iPSCs were differentiated as illustrated in Fig. 1A in the absence of small-molecule adjunct treatment (non-treated, NT) or in the presence of CHIR/SB (CS), LY or CHIR/SB/LY (CSLY). All analyses were performed with HSPCs collected at day 12 of differentiation with indicated treatments. (A) Representative flow cytometry plots of phenotypically defined HSCs (CD45+CD34+CD45RA−CD90+). (B) Percentages of phenotypically defined HSCs. (C) Absolute numbers of phenotypically defined HSCs per culture well. (D) Quantitative PCR analysis of PROM1 and HLA-DRA molecular markers associated with hematopoietic maturity in phenotypically defined HSCs. Data were normalized to the NT control group. (E) Quantitative PCR analysis of CDH5 and MEIS2 molecular markers associated with hematopoietic immaturity in phenotypically defined HSCs. Data were normalized to the NT control group. Data shown in this figure were obtained with human iPSC line MCND-TEN-S2. Reproducibility of data was confirmed with human iPSC line HT915 (Supplementary Fig. S5). In panels B-E, data are displayed as mean ± SEM of 3 to 8 independent experiments. One-way ordinary ANOVA test with Dunnett correction was used. ns, not significant, *P ≤ 0.05, **P ≤ 0.01, ***P ≤ 0.001, ****P ≤ 0.0001. Associated with Supplementary Fig. S5.

