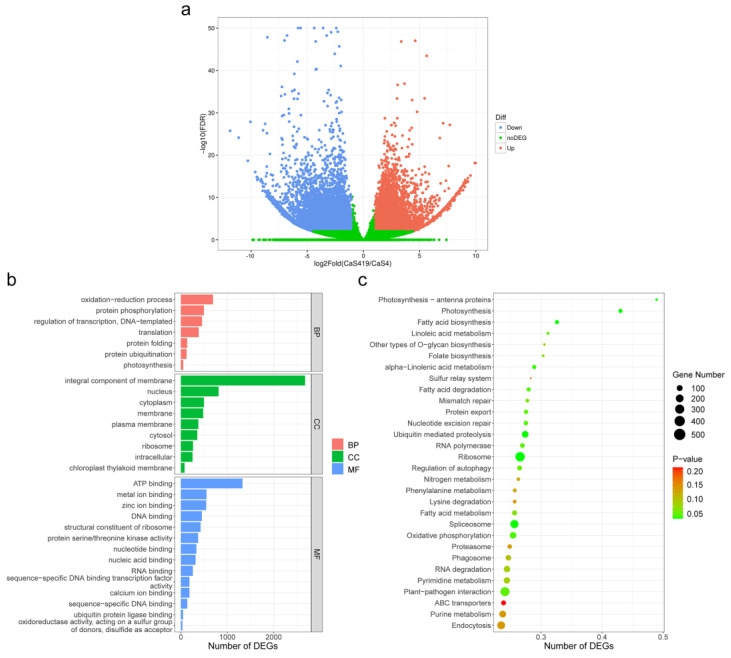
Figure 3.
(a) Expression patterns of differentially expressed genes (DEGs) identified between ‘QianFu 4’ triploid tea and ‘Qianmei 419’ diploid tea. Red(16,459 single genes) and blue(7354 genes) dots represent DEGs, while green dots indicate genes that were not differentially expressed. (b) GO enrichment results of DEGs. Red represents a biological process, blue represents the cellular component and cyan represents molecular function. (c) KEGG enrichment results of DEGs.

