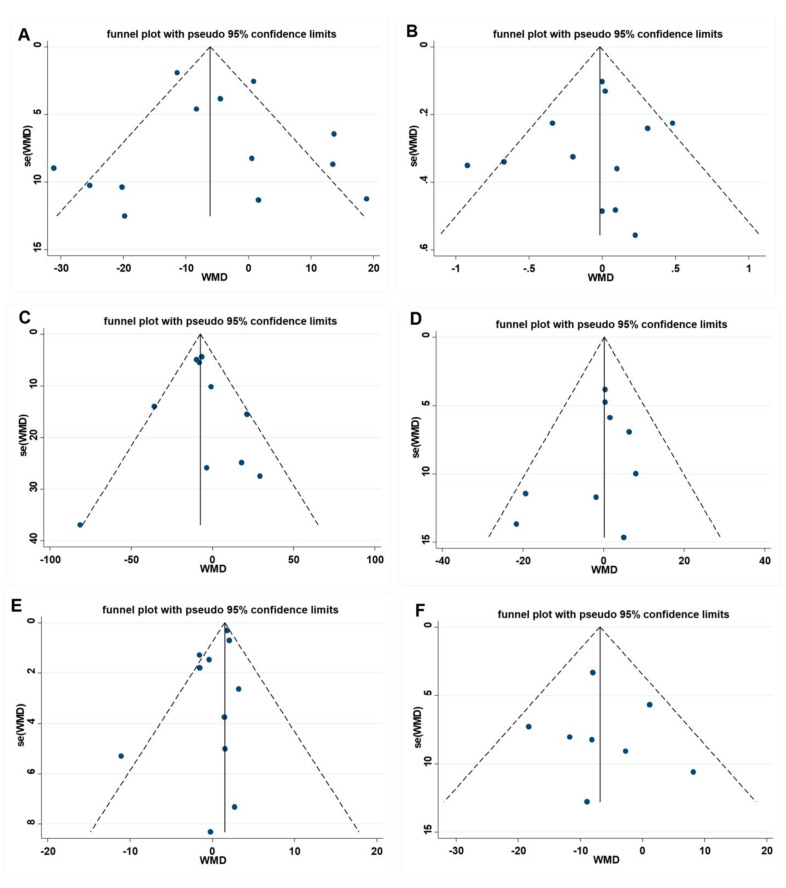
Figure 5.
Funnel plot and Egger test for assessing publication bias, (A) FBG Egger’s test (p = 0.699), (B) HbA1c Egger’s test (p = 0.576), (C) TG Egger’s test (p = 0.842), (D) TC Egger’s test (p = 0.233), (E) HDL-C Egger’s test (p = 0.103), and (F) LDL-C Egger’s test (p = 0.092). A = FBG, B = HbA1c, C = TG, D= TC, E = HDL-C, F = LDL-C. FBG= fasting blood glucose; HbA1c = Glycosylated hemoglobin; TG = Triglyceride; TC = Total cholesterol; HDL-C = High-density lipoprotein cholesterol; LDL-C = Low-density lipoprotein cholesterol.

