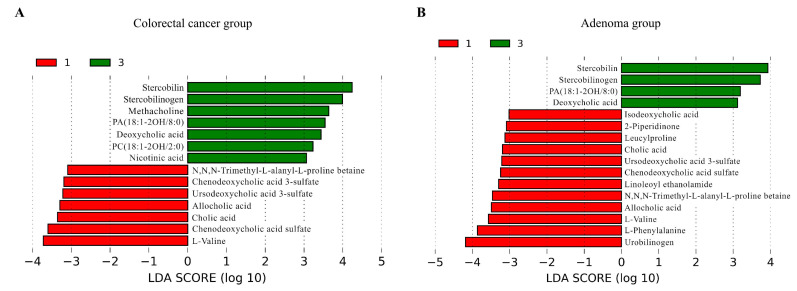
Figure 2.
Differential metabolites between type I and type III subtypes in CRC and CRA groups identified by LEfSe analysis, with a logarithmic LDA score > 3. (A) LDA score plot for the CRC group comparison. (B) LDA score plot for the CRA group comparison. Red bars on the left represent type I, while green bars on the right indicate type III. Longer bars signify a greater degree of difference between the subtypes for each metabolite. CRA, colorectal adenoma; CRC, colorectal cancer; LDA, linear discriminant analysis; LEfSe, linear discriminant analysis effect size.

