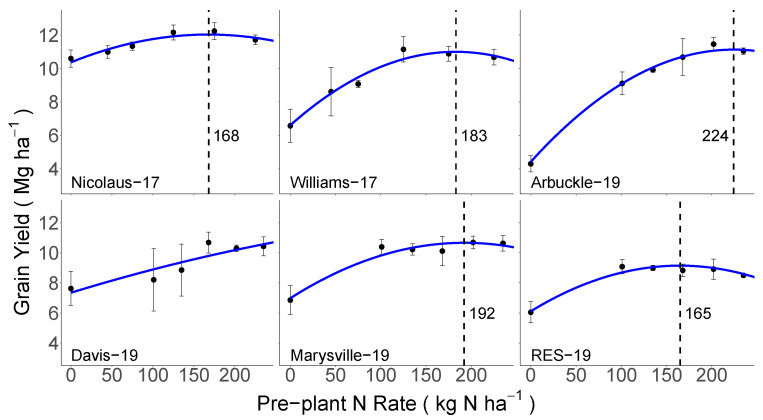
Figure 3.
The relationship between the pre-plant N rate and rice grain yield without top-dress N for each site-year, as described by a quadratic linear mixed-effects model. The vertical dashed lines and values reported represent the optimal pre-plant N rate for each site (i.e., the N rate required to achieve maximum yields). Note: the relationship did not level-off at the Davis-19 site within the range of pre-plant N rates used in this study, and thus no pre-plant N rate is marked.

