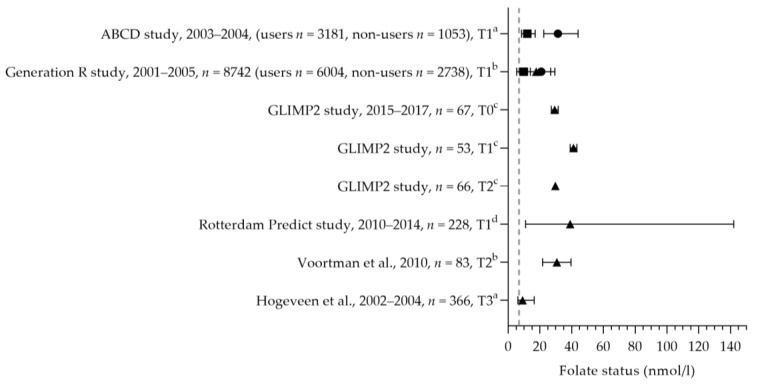
Figure 6.
Folate status of pregnant women. Squares indicate the status of non-supplement users; dots indicate the status of supplement users; triangles indicate the status of the total study population. The dotted vertical line represents the reference value. T0 = preconception; T1 = first trimester; T2 = second trimester. a = median with interquartile range (IQR); b = mean with standard deviation (SD); c = mean with standard error of the means (SEM); d = median with minimum and maximum value. ABCD study [78]. Generation R study [70]. GLIMP2 study [50]. Rotterdam Predict study [80]. Voortman et al. [57]. Hogeveen et al. [61].

