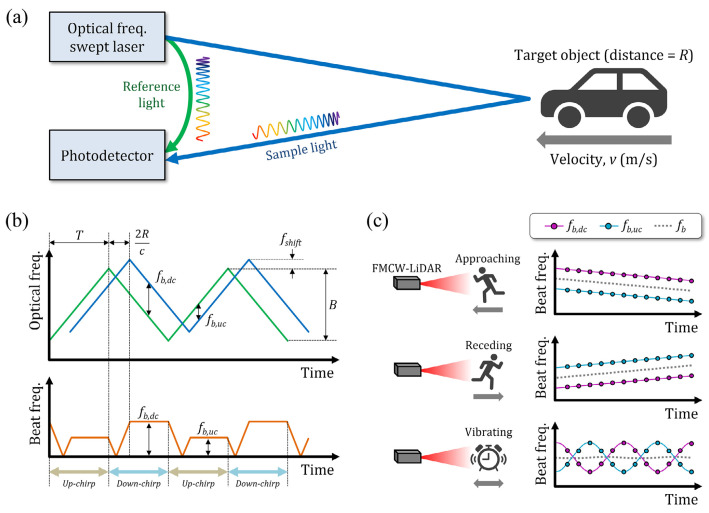
Figure 4.
A conceptual diagram of FMCW Lidar. (a) The work diagram of FMCW Lidar. (b) Beat frequency of the reference signal (green) and sample signal (blue). (c) Beat frequency over time in the different moving cases, the blue and purple circles represent the measured peak beat frequencies [30].

