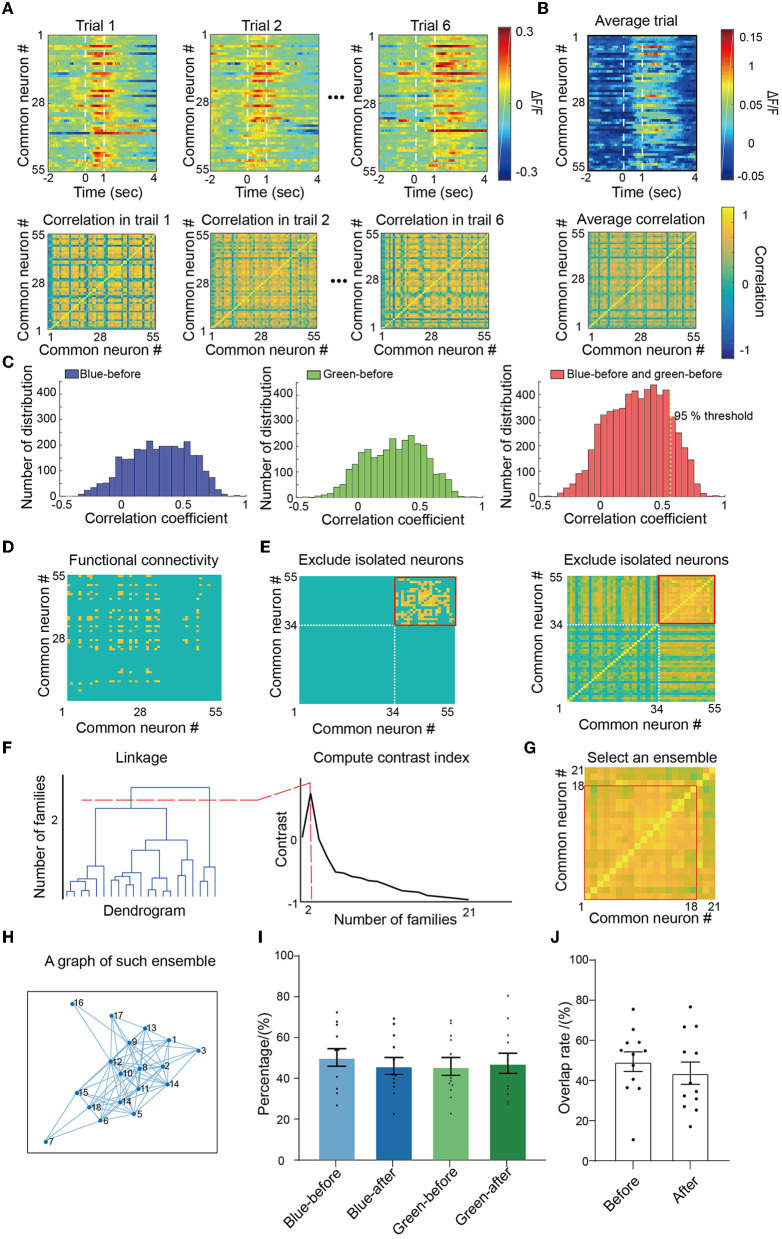
Figure 2.
Identification of ensembles. (A) For each trial, Pearson's correlation was calculated between each pair of identified neurons and formed correlation matrices within one mouse. (B) Average correlation matrices, respectively, for both color and conditions. (C) Left: blue-before-conditioning correlation matrix distribution; middle: green-before-conditioning correlation matrix distribution; right: accumulated blue-before-conditioning and green-before-conditioning correlation matrix distribution. A ranked 95% correlation coefficient was picked up as the threshold for functional connection. (D) An example of blue-before-conditioning average functional connectivity matrix after applying the threshold. (E) Exclude isolated neurons that had no connection with all other neurons. (F) Clustering survived neurons with ward linkage and contrast index. (G) Find the cluster which has the highest mean correlation value as an ensemble. (H) An example graph of such ensemble. (I) The proportion of neurons in different ensembles. No significant differences were found in each comparison between pairs of conditions by paired-sample t-test; n = 12 recording sites from eight mice. (J) Overlapping rates between blue-before-conditioning and green-before-conditioning ensembles, and overlapping rates of between blue-after-conditioning and green-after-conditioning ensembles; n = 12 recording sites from eight mice. Mean ± SEM was drawn in the histogram.

