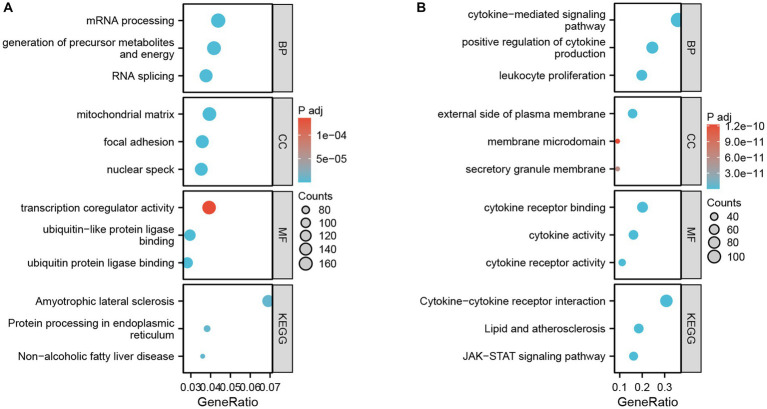
Figure 3.
GO terms and KEGG pathway enrichment. (A) Details of GO terms and KEGG pathway enrichment for GSE4172. The colored dots represent the p value for that term, with red representing greater significance. The size of the dot represents the number of genes involved. (B) Details of GO terms and KEGG pathway enrichment for GSE211378.

