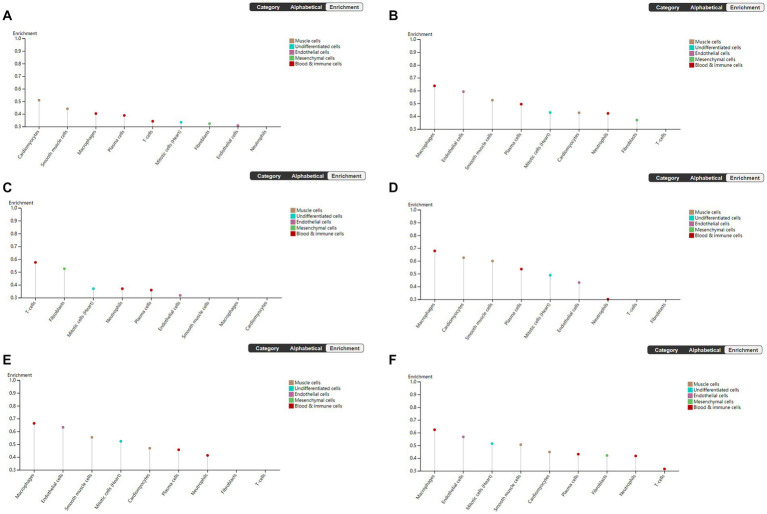
Figure 6.
Human Protein Atlas was used to analyze hub genes. The plot shows the enrichment prediction score for each cell type profiled in heart muscle. This score is the mean correlation between the selected gene and the 3 reference transcripts selected to represent each cell type profiled within the tissue. (A) VEGFA, (B) FOXO1, (C) CXCR4, (D) SMAD4, (E) KRAS, and (F) TXN.

