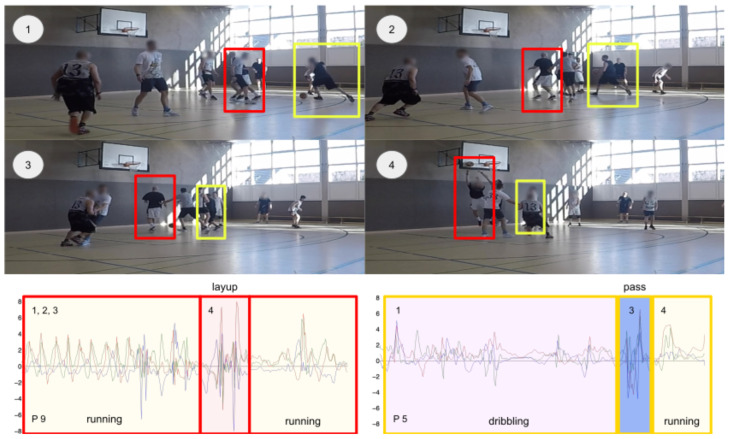
Figure 1.
A scene and activities from the dataset: Offensive play of player 12 (yellow) and player 6 (red), see Table 6, with player 12 dribbling the ball (1), (2) and then passing (3) it to player 6. Player 6 then performs a layup (4). Video frames 1–4 and the performed activities are highlighted in the time-series below. The activity running is marked as yellow, layup as red, dribbling as mauve and pass is colored in blue.

