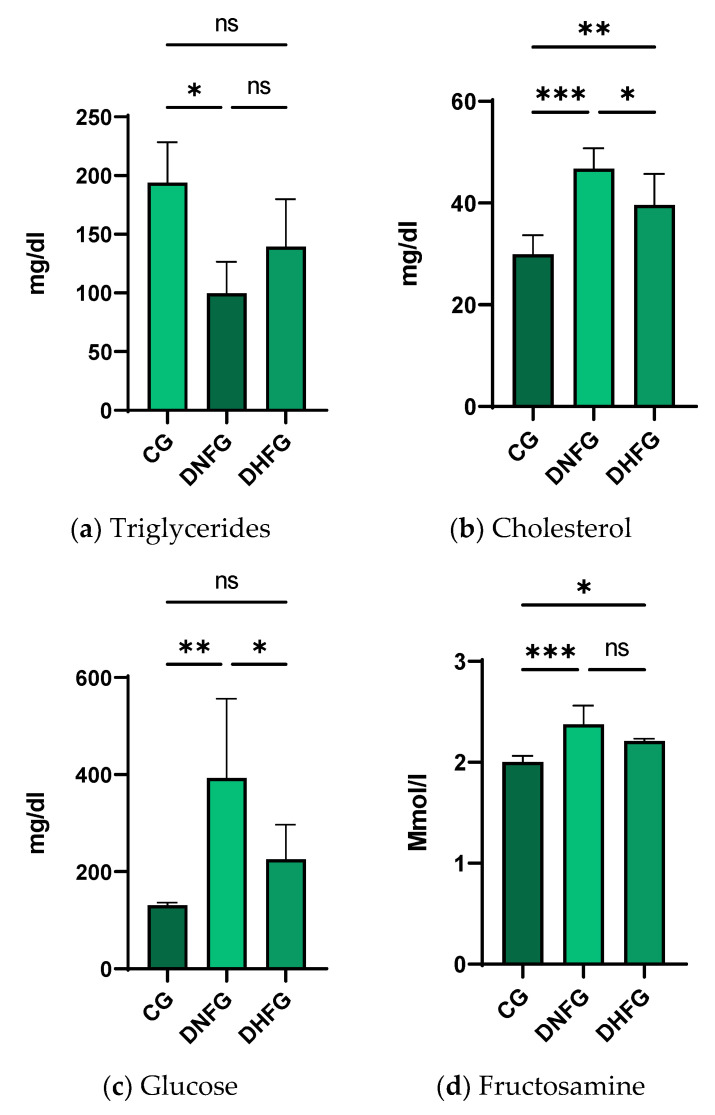
Figure 3.
Blood biochemical changes for (a) triglyceride, (b) cholesterol, (c) glucose and (d) fructosamine after 5 weeks of treatment in CG, Control Group, which received water and normal feed; DNFG, Diabetic Normal Feed Group—the rats were fed with normal feed; DHFG, Diabetic Hemp Seeds Feed Group—the animals received only hemp seeds as feed. Values are means ± standard deviation (M ± SD), n = 6, p ≤ 0.05 (*), p ≤ 0.01 (**) and p ≤ 0.001 (***) (Kruskal–Wallis test for triglycerides and one-way ANOVA for the other parameters).

