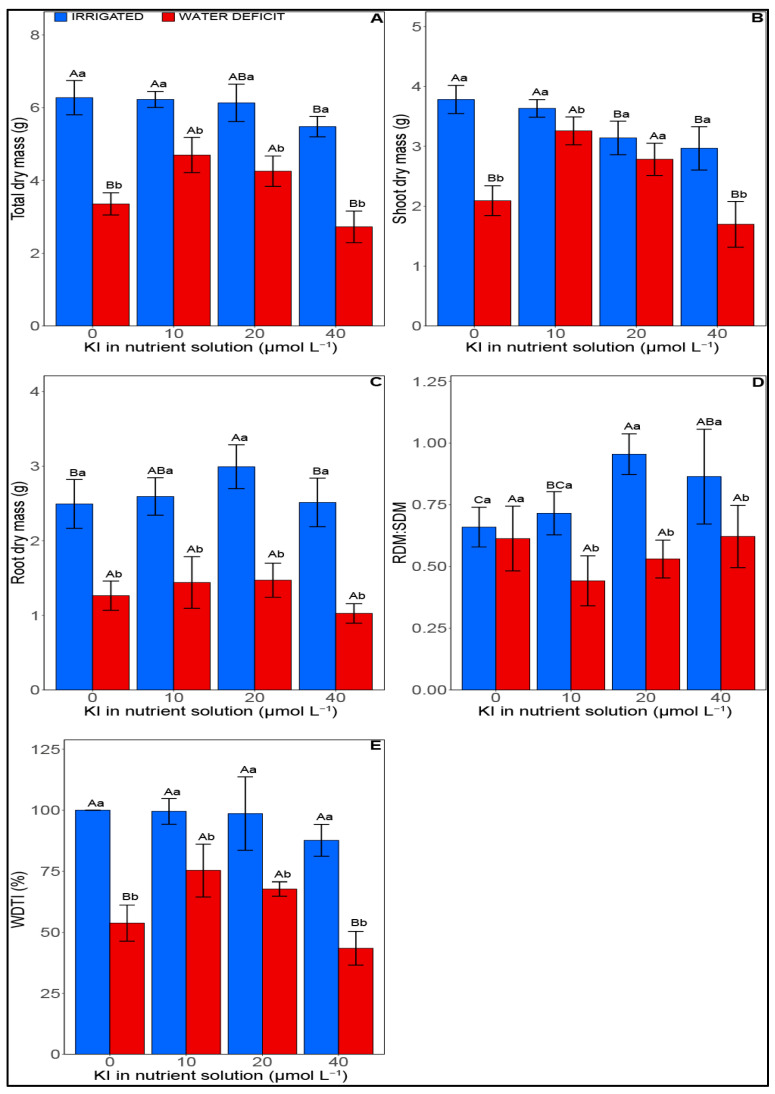
Figure 1.
Effect of KI on growth attributes of soybean plants under water deficit or not. (A) total dry mass, (B) Shoot dry mass, (C) root dry mass, (D) RDM:SDM—shoot root relationship, and (E) WDTI—water deficit tolerance index. Irrigated samples are represented with blue bars, on the left, while samples with water deficit with red bars, on the right. Values are presented as average ± SD (n = 5). Equal letters indicate no significant differences (p > 0.05) calculated using the Tukey test. Equal uppercase letters indicate no distinction between KI concentrations, while equal lowercase letters indicate no distinction between the irrigation conditions (p > 0.05).

