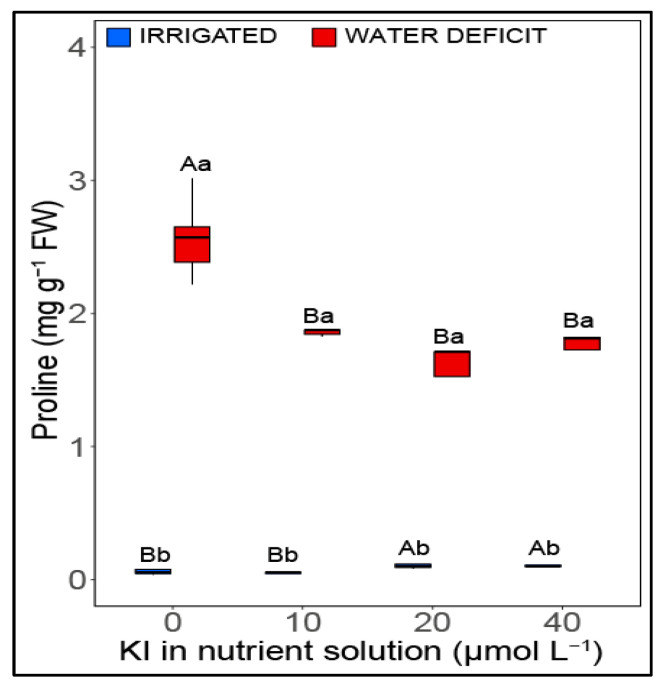
Figure 5.
Effect of KI on content proline of soybean plants under well-watered conditions (blue columns, on the left) and water deficit (red columns, on the right) one day before rehydration. Values are presented as average ± SD (n = 5). Equal letters indicate no significant differences calculated using the Tukey test (p > 0.05). Different uppercase letters represent statistical differences (p < 0.05) between KI concentrations, while lowercase letters indicate differences between irrigation conditions. Graphs represented in the boxplot indicate that the data did not meet the assumptions of normality and homogeneity of variance, requiring a transformation by rank.

