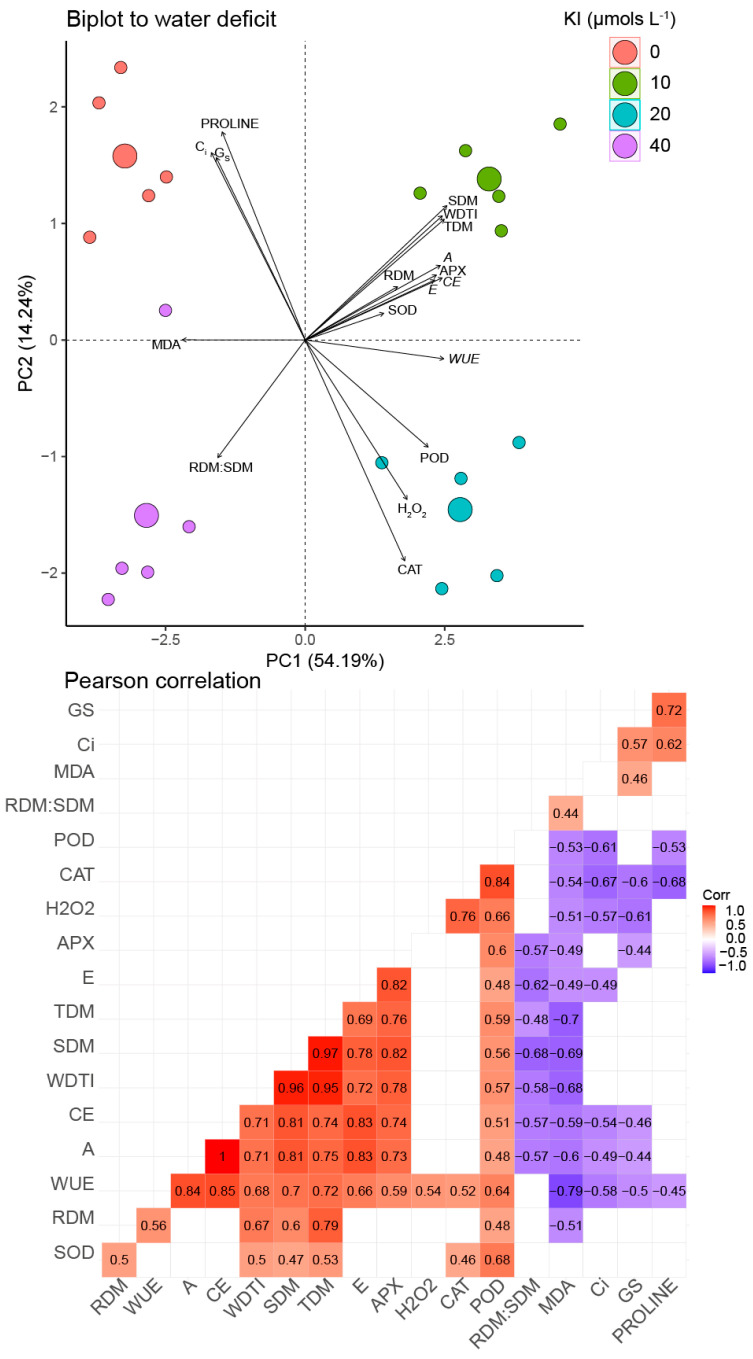
Figure 7.
Principal component analysis and Pearson correlations using morphophysiological and biochemical data on soybean plants in response to water deficit and KI application. Significant correlation coefficients (q < 0.01) are indicated with bold numbers, where positive and negative correlations are distinguished with red and blue, respectively. Non-significance is indicated with white boxes without numbers. TDM—total dry mass; SDM—shoot dry mass; RDM—root dry mass; WDTI—water index tolerance; H2O2—hydrogen peroxide; MDA—malondialdehyde; A—CO2 assimilation rate; gs—stomatal conductance; Ci—internal concentration of CO2; E—transpiration; WUE—water use efficiency; CE—carboxylation efficiency; POD—guaiacol peroxidase; APX—ascorbate peroxidase; CAT—catalase.

