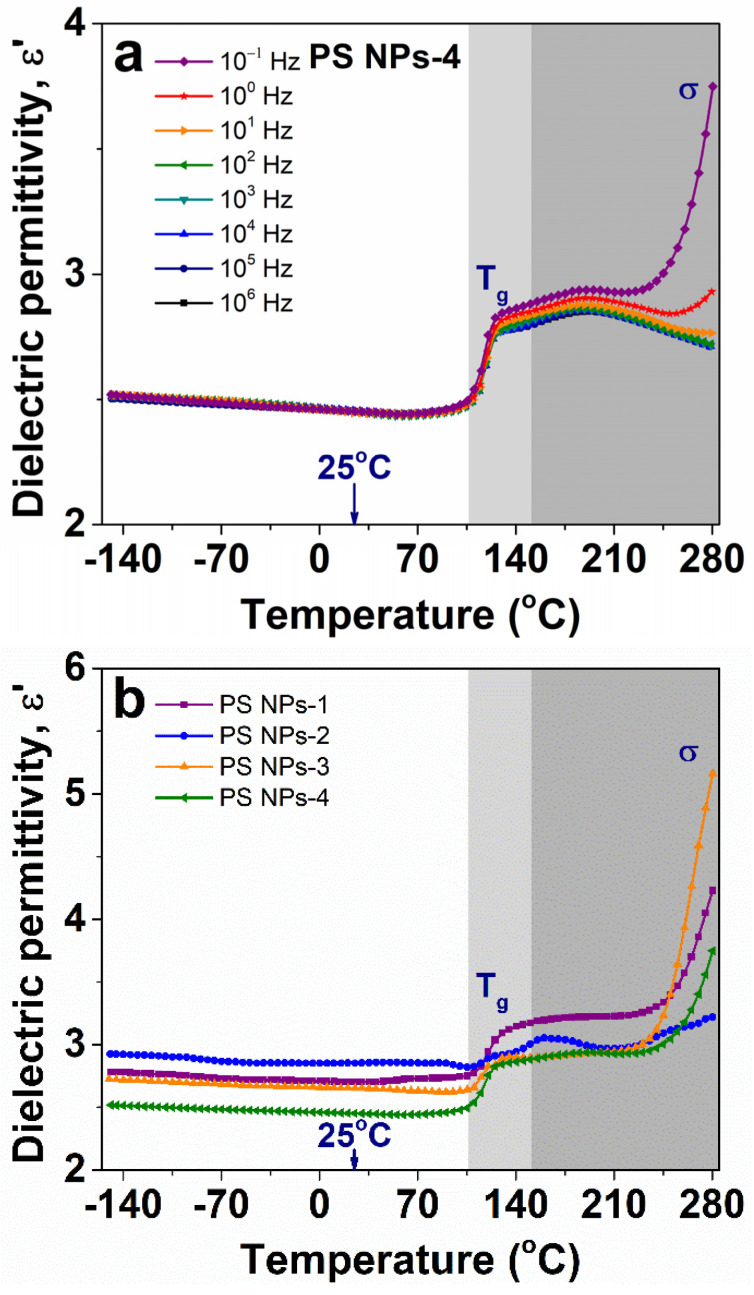
Figure 8.
(a) Evolution of dielectric permittivity with different temperatures at various frequencies for PS NPs-4 sample, and (b) comparative evolution of dielectric permittivity with temperature at 0.1 Hz for all investigated samples. The light grey marked area delimitates the step-increase in ε′ when the glass transition of polystyrene occurs. The darker grey marked area corresponds to the increase in ε′ as a consequence of the existence of free charges.

