Figure 1.
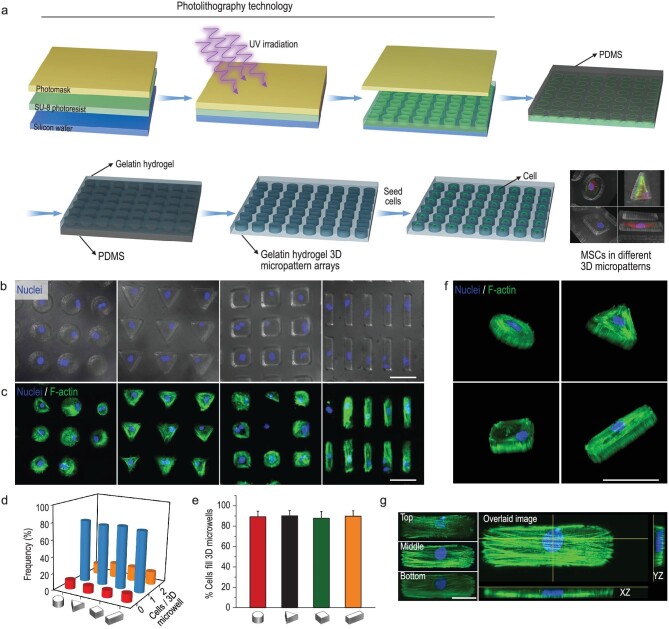
Fabrication of 3D micropattern arrays and single MSCs occupancy in the microwells. (a) Schematic illustration of the process for fabricating hydrogel 3D micropattern arrays. (b) Fluorescence images showed nuclear staining of the single cell encapsulated in 3D micropatterns with different geometries but the same volume (cylinder, triangular prism, cubic, and cuboid). Scale bar, 50 μm. (c) Confocal images showed that MSCs morphology was well controlled by the 3D micropattern. The F-actin and nucleus were labeled with phalloidin (green) and DAPI (blue), respectively. Scale bar, 50 μm. (d) Quantitative results of MSCs encapsulation efficiency in the 3D micropattern with different geometries. (e) Quantitative results of cells filling in 3D microwells with different geometries; the regions for quantitative analysis were selected randomly, n ≥ 4. (f) Three-dimensional reconstruction of F-actin and nucleus in different 3D micropatterns, green: F-actin, blue: nucleus. Scale bar, 50 μm. (g) The overlaid confocal image showed that F-actin was well arranged in cuboid micropatterns. Overlaid image was generated by merging multi–z-stack images into a single stack. Scale bar, 20 μm.

