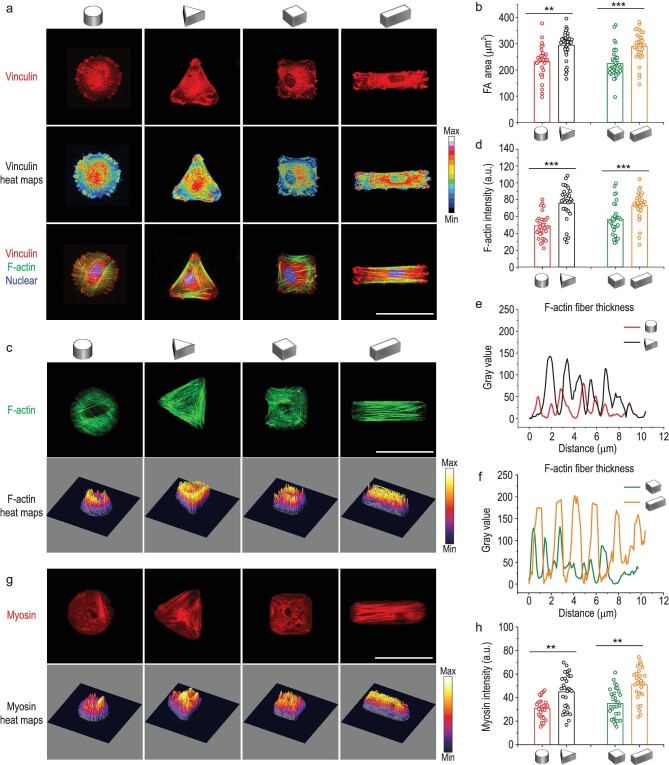
Figure 2.
Spatial reorganization of focal adhesions and cytoskeletal in response to cell shape changes in 3D micropatterns. (a) Representative confocal images of vinculin (red) identifying focal adhesions, F-actin (green) and nucleus (blue) for the single cell in 3D micropatterns. Scale bar, 50 μm. (b) Quantification of the total focal adhesions area of cells confined in 3D micropatterns. (c) Fluorescence images of F-actin filament staining for MSCs cultured in 3D micropatterns. Scale bar, 50 μm. (d) Quantification of fluorescence intensity of F-actin in different 3D micropatterns. (e and f) F-actin fibers thickness in 3D micropatterns evaluated by fluorescence intensity. (g) Representative fluorescence images of myosin staining of MSCs cultured in 3D micropatterns. Scale bar, 50 μm. (h) Quantification of myosin intensity of MSCs cultured in 3D micropatterns. The data are represented as the mean ± SD, n = 30–40 cells per condition, ** p < 0.01, *** p < 0.001.

