Figure 3.
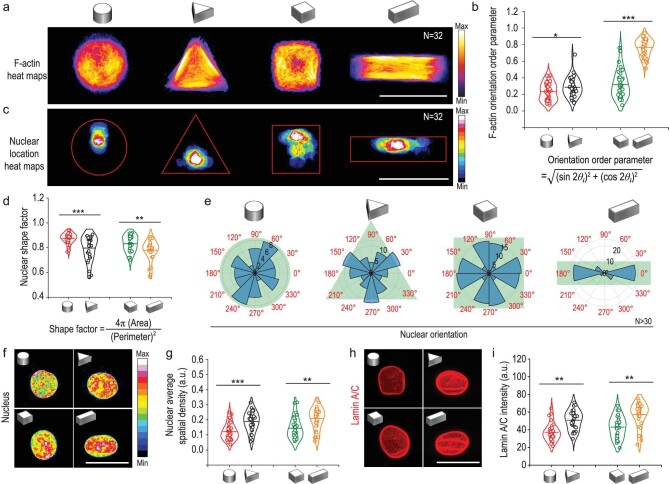
3D geometric constraints regulate cellular F-actin orientation, nuclear morphology and mechanics. (a) F-actin immunofluorescence intensity heat maps of MSCs cultured in 3D micropatterns. N was the number of cells used for heatmap generation. Scale bar, 50 μm. (b) F-actin orientation order parameter in 3D micropatterned cells. (c) Nucleus location heat maps of cells cultured in 3D micropatterns. (d) Quantification of nuclear shape factor estimated from projected nuclear morphology. (e) Angular graphs, superimposed on micropattern drawings in reseda, showed the different orientations of nuclei in response to different 3D micropatterns. Here, N was the number of cells used for nucleus orientation analysis. (f and g) Chromatin condensation was visualized by generating a heatmap of the DAPI intensity. Quantitation of nucleus average spatial density (overall fluorescence intensity per nuclear volume) for 3D micropatterned cells. Scale bar, 20 μm. (h and i) Representative confocal images of nucleus Lamin A/C and quantitation of nucleus Lamin A/C intensity level of MSCs cultured in 3D micropatterns. Scale bar, 20 μm. The data were represented as the mean ± SD, n = 30–40 cells per condition, * p < 0.05, ** p < 0.01, *** p < 0.001.

