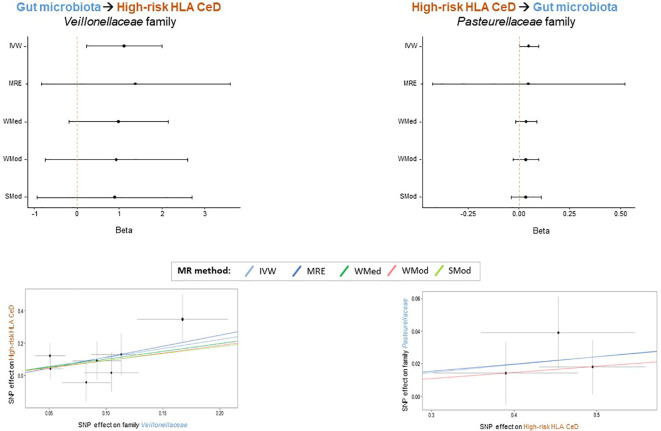
Figure 2.
Bacterial taxa that might play a specific causal role in the interplay between GM and HR HLA CeD. Forest plots (upper panels) depict the consistency of the effect obtained across the 2SMR methods. Scatter plots (lower panels) show the consistent positive beta effect obtained with each method: Inverse Variance Weighted (IVW), MR Egger (MRE), Weighted Median (WMed), Weighted Mode (WMod), and Simple Mode (SMod).

