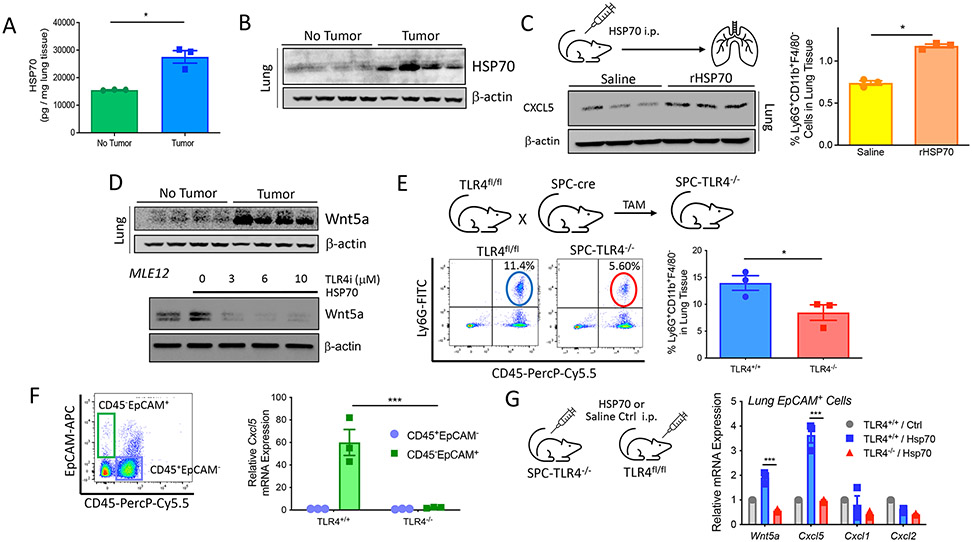
Fig. 2. HSP70 stimulates a TLR4-Wnt5a signaling axis in lung epithelial tissues to drive PMN-MDSC accumulation.
(A) HSP70 ELISA analysis of lung tissues harvested from non–tumor-bearing and tumor-bearing BRAFV600EPTEN−/− mice (n = 3). (B) HSP70 Western blot analysis of lung tissues harvested from non–tumor-bearing and tumor-bearing BRAFV600EPTEN−/− mice (n = 4). (C) CXCL5 Western blot analysis (left) and flow cytometry analysis of PMN-MDSCs (right) in lung tissues after intraperitoneal delivery of normal saline versus recombinant HSP70 (rHSP70; n = 3). i.p., intraperitoneal. (D) Top: Wnt5a Western blot analysis of lung tissues harvested from non–tumor-bearing and tumor-bearing BRAFV600EPTEN−/− mice (n = 4). Bottom: Wnt5a Western blot analysis of MLE12 lung epithelial cell lysates after rHSP70 treatment ± TLR4 inhibitor (TLR4i). (E) Flow cytometry analysis of PMN-MDSCs in the lung tissues of TLR4fl/fl (TLR4+/+) and SPC-TLR4−/− (TLR4−/−) transgenic mice (n = 3) after tamoxifen (TAM) treatment. (F) Cxcl5 qrt-PCR analysis of CD45+EpCAM− and CD45−EpCAM+ cells FACS-sorted from the lung tissues of tumor-bearing TLR4f/f and SPC-TLR4−/− transgenic mice (n = 3). The representative flow cytometry gating strategy is shown on the left. Statistical analysis was performed by two-way ANOVA followed by Sidak’s multiple comparisons test. APC, allophycocyanin. (G) Wnt5a, Cxcl5, Cxcl1, and Cxcl2 qrt-PCR analysis of CD45−EpCAM+ cells FACS-sorted from tumor-bearing TLR4f/f and SPC-TLR4−/− transgenic mice after intraperitoneal delivery of normal saline versus rHSP70 (n = 3). Statistical analysis was performed by two-way ANOVA followed by Tukey’s multiple comparisons test. All two-group comparisons were analyzed using unpaired t tests. All data representative of two to three independent experiments and expressed as mean values ± SEM. *P < 0.05 and ***P < 0.0005.

