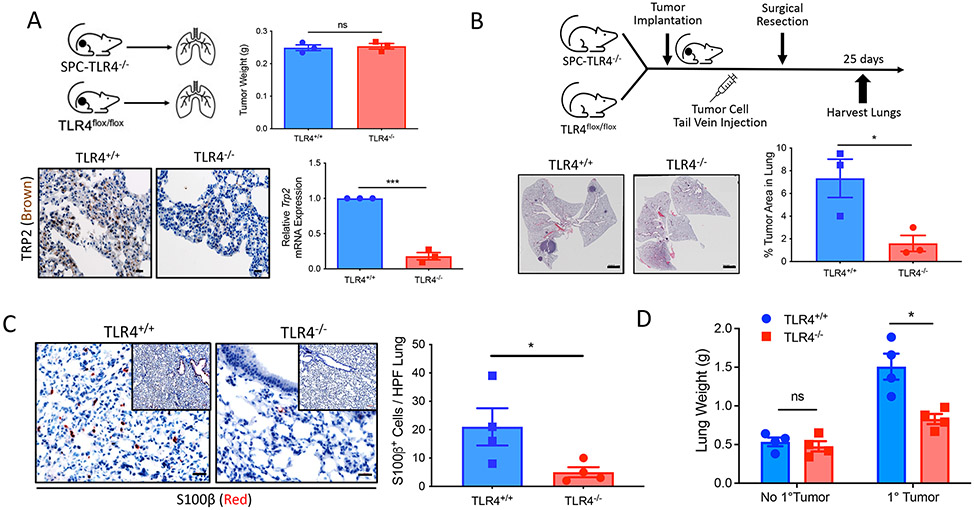
Fig. 3. The TLR4-Wnt5a signaling axis in lung epithelial tissues promotes pulmonary metastatic progression.
(A) Top: Primary BRAFv600EPTEN−/− tumor weight measurements after resection from TLR4f/f (TLR4+/+) and SPC-TLR4−/− (TLR4−/−) transgenic mice (n = 3). Bottom: Representative TRP2 IHC and TRP2 qrt-PCR analysis of lung tissues resected from TLR4f/f and SPC-TLR4−/− transgenic mice bearing BRAFV600EPTEN−/− tumors (n = 3). The IHC images are shown at 40×. Scale bars, 20 μm. ns, not significant. (B) Left: Representative low-magnification imaging of lungs resected from TLR4+/+ and SPC-TLR4−/− transgenic mice after BRAFV600EPTEN−/− tumor tail vein injection. Images are shown at 4×; Scale bars, 2000 μm. Right: Quantification of the area of tumor burden per whole lung (n = 3). (C) Left: Representative S100β IHC of lung tissues resected from TLR4+/+and SPC-TLR4−/− transgenic mice after BRAFV600EPTEN−/− tumor tail vein injection. Images are shown at 40×; Scale bars, 20 μm. Inset images are shown at 10×. Right: S100β-positive cells enumerated per lung based on IHC microscopy. HPF, high-power field. Analysis performed at 40×. (n = 4). (D) Lung weight measurements after resection from TLR4+/+ and SPC-TLR4−/− transgenic mice ± primary BRAFV600EPTEN−/− tumor (n = 4). g, gram. Statistical analysis was performed by two-way ANOVA followed by Sidak’s multiple comparisons test. All two-group comparisons were analyzed using unpaired t tests. All data are representative of two to three independent experiments and expressed as mean values ± SEM. ns, nonsignificant; *P < 0.05 and ***P < 0.0005.

