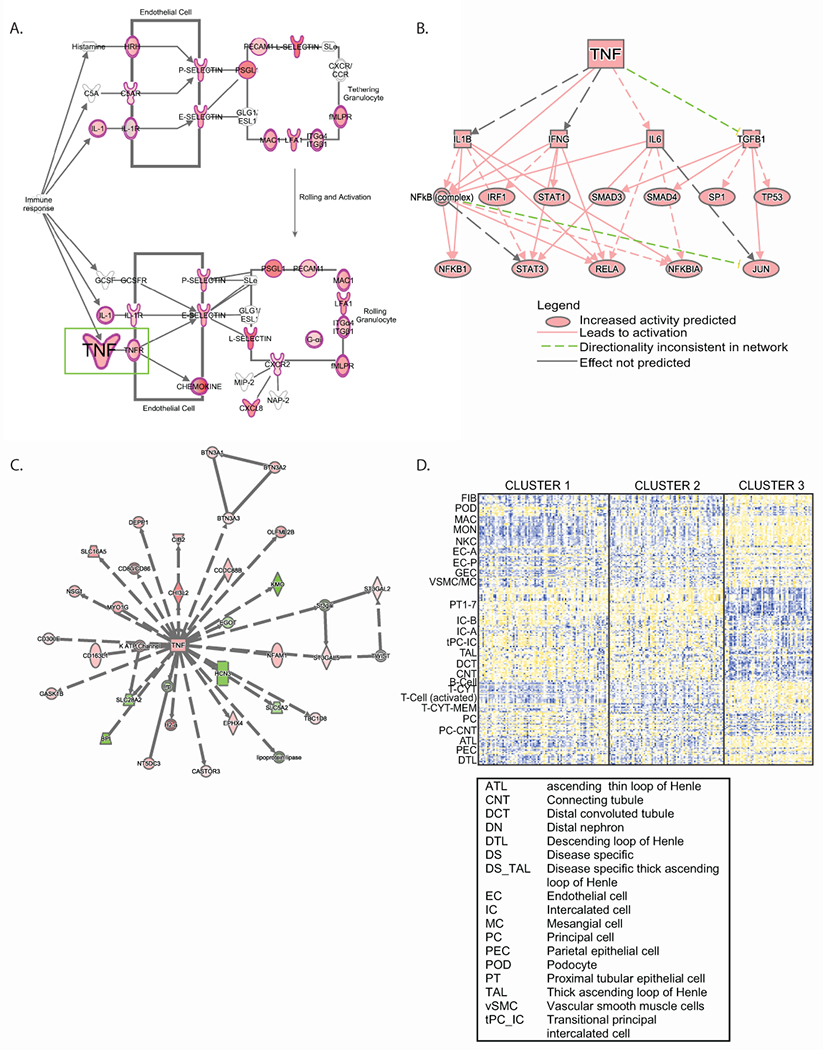
Figure 3. Molecular and functional context of cluster T3 expression profiles.

Differential expression profiles from T3 compared to T1 and T2 in the NEPTUNE cohort were generated, and enrichment analysis was performed using Ingenuity Pathways Analysis. (A) Granulocyte adhesion and diapedesis was the top enriched canonical pathway; a subset of the pathway is shown highlighting TNF as an input to the pathway. Genes highlighted in red were up-regulated in the differential expression profile. (B) A mechanistic network of predicted upstream regulators from the differential expression profile indicating TNF as an input. (C) TNF was identified in a gene interaction network (red indicates the gene was up-regulated in the differential expression profile, while green indicates down-regulation). (D) Cell selective gene expression markers were previously identified26 and were intersected with voom-transformed gene (row) normalized expression data (yellow indicates higher expression, blue indicates lower expression) to elucidate probable cell contribution to differential expression profiles.
