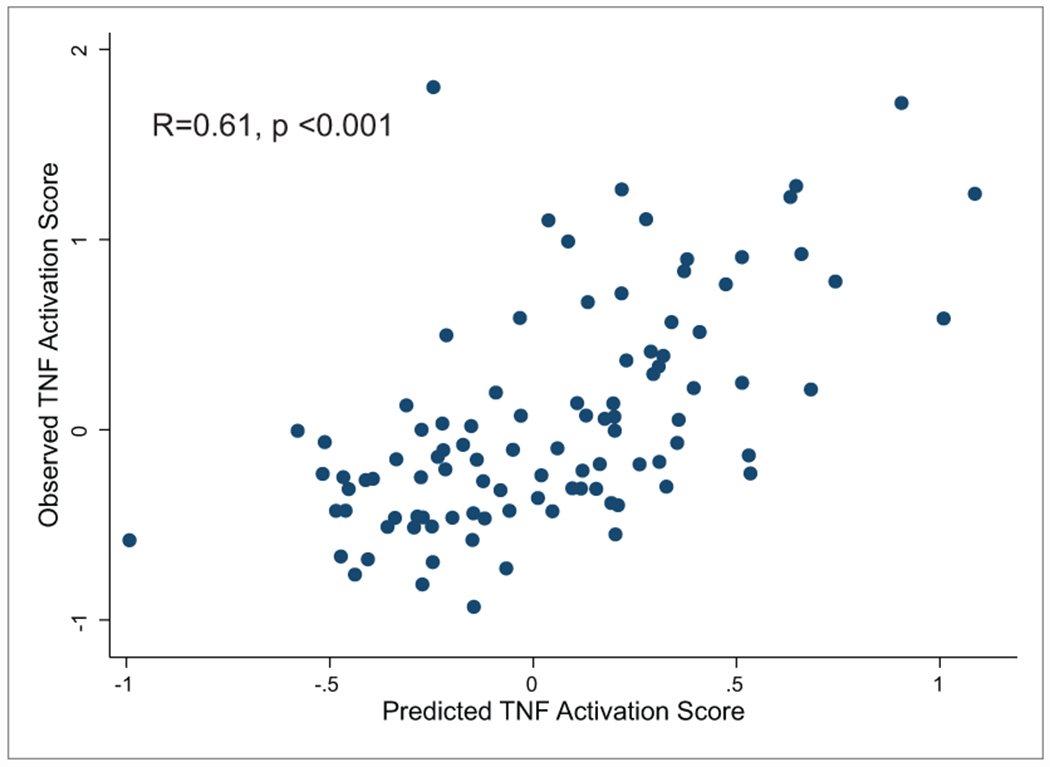
Figure 8: Correlation of observed TNF activation score with a predicted score based on urinary biomarkers and clinical features.

Linear regression models were used to generate predicted tissue TNF activation scores based on eGFR, UPCR, urinary TIMP1 and urinary MCP1. Correlation was 0.61, p-value <0.001.
