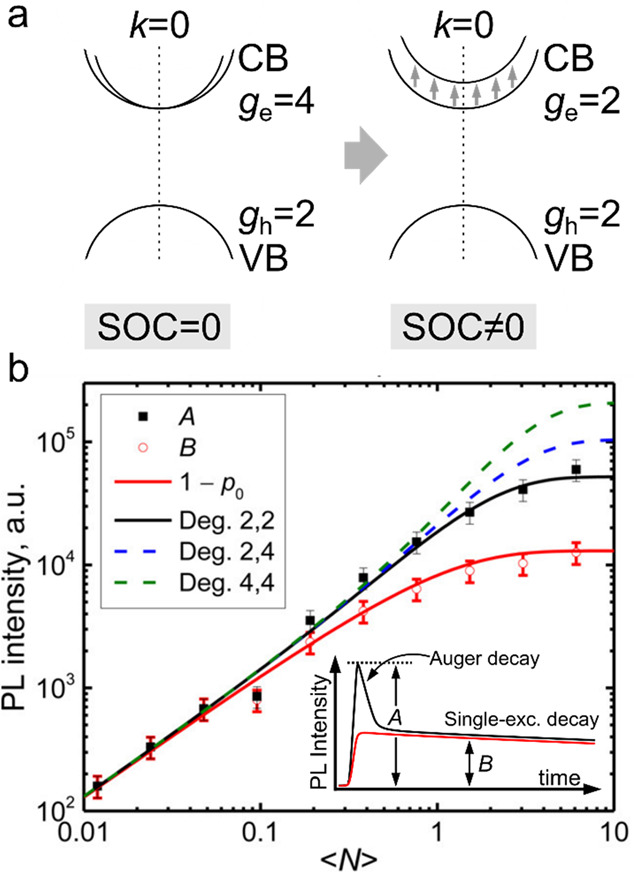
Figure 26.

(a) An approximate band diagram of a CsPbX3 perovskite without (left) and with (right) inclusion of effects of spin–orbit coupling (SOC). If one accounts for splitting of the CB states due to SOC, the CB band-edge degeneracy is reduced from 4 to 2. (b) The early- and late-time PL signals (A and B, respectively) of the CsPbBr1.5I1.5 nanocrystals as a function of ⟨N⟩ obtained from the PL time transients (inset) recorded using excitation with 3.6 eV, 220 fs pulses. At large ⟨N⟩, when both signals are saturated, their ratio is controlled by the degeneracies of the CB and VB states that define their maximal occupancies. Based on the conducted modeling, the measurements are best described assuming ge = gh = 2 (black solid line). The dashed lines show modeling for gmin = 2 and gmax = 4 (blue), and gmin = gmax = 4 (green). Here, gmin = min(ge, gh) and gmax = max(ge, gh). The red line is calculated from (1 – p0), there p0 is the fraction of unexcited nanocrystals obtained using Poisson statistics of photon absorption events. Adapted with permission from ref (100). Copyright 2016 American Chemical Society.
