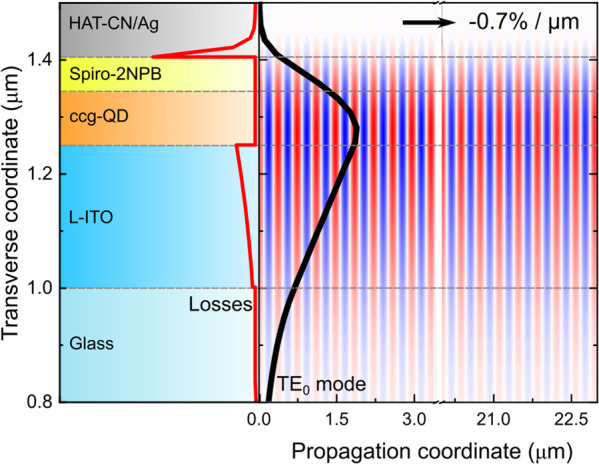
Figure 41.

A device architecture that features reduced optical losses. It has the following structure: glass/L-ITO (250 nm)/ccg-QDs (95 nm)/Spiro-2NPB (50 nm)/HAT-CN (10 nm)/Ag (100 nm). A COMSOL-based photonic simulation of the spatial distribution of the intensity of the TE0 mode and the loss coefficient are shown by the black and red lines, respectively. The striped image to the right illustrates a propagation pattern of the TE0 mode. Reproduced with permission from ref (62) (CC-BY 4.0).
