Figure 5.

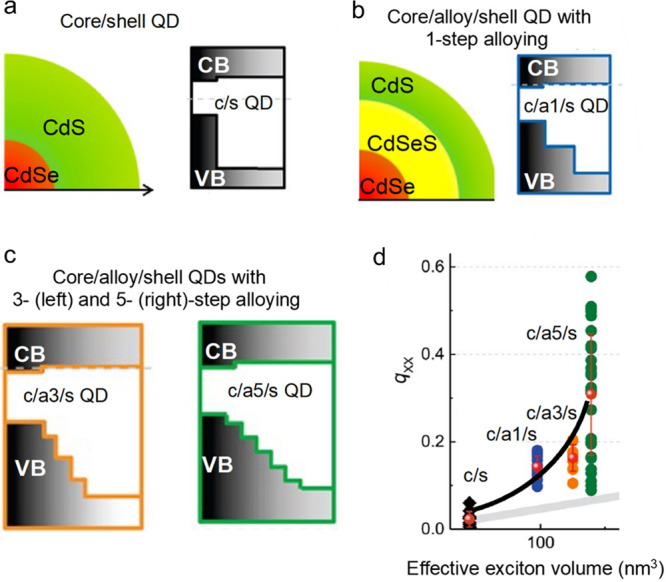
(a) A schematic depiction of a core/shell CdSe/CdS QD (left) and its band diagram (right). (b) Same for a CdSe/CdSexS1–x/CdS QD with an alloyed CdSexS1–x interlayer (1-step alloying). (c) A core/alloy/shell CdSe/CdSexS1–x/CdS QD (left) wherein an alloyed interlayer comprises 3 (left) and 5 (right) layers with different Se-to-S ratios, which leads to a progressively more gradual change of the confinement potential. (d) The increase in the number of alloying steps leads to the increased biexciton emission quantum yield (qXX) indicating more complete suppression of Auger decay. The black, blue, orange, and green symbols are data points obtained using single-dot measurements. The black line is a guide for the eye which describes the dependence of the average biexciton emission quantum yields (red symbols) on effective exciton volume. The gray line is the trend expected for traditional V-scaling of Auger lifetimes. Considerable deviation between the black and the gray lines which increases with the number of alloying steps indicates the increasing degree of Auger-decay suppression. Adapted with permission from ref (57). Copyright 2014 American Chemical Society.
