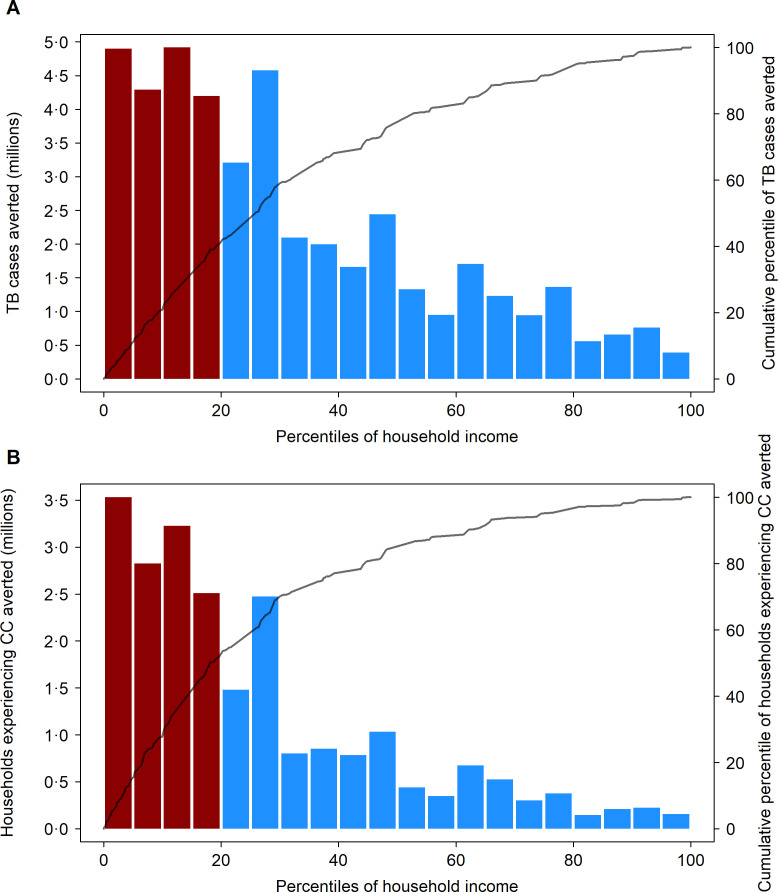
Figure 3.
Distribution of tuberculosis cases averted (A) and number of households experiencing catastrophic costs averted over 2028–2050 (B) by an adolescent/adult vaccine across all modelled strata, ordered by household income. CC, catastrophic costs; GDP, gross domestic product; TB, tuberculosis. Bars defined by left-hand side y-axis; lines defined by right-hand side y-axis. Ordering of population by household income based on average 2020 per capita GDP in purchasing power parity (PPP) dollars, for each modelled stratum (525 total strata). Bars shaded red indicate the poorest 20% of modelled population by PPP GDP per capita.

