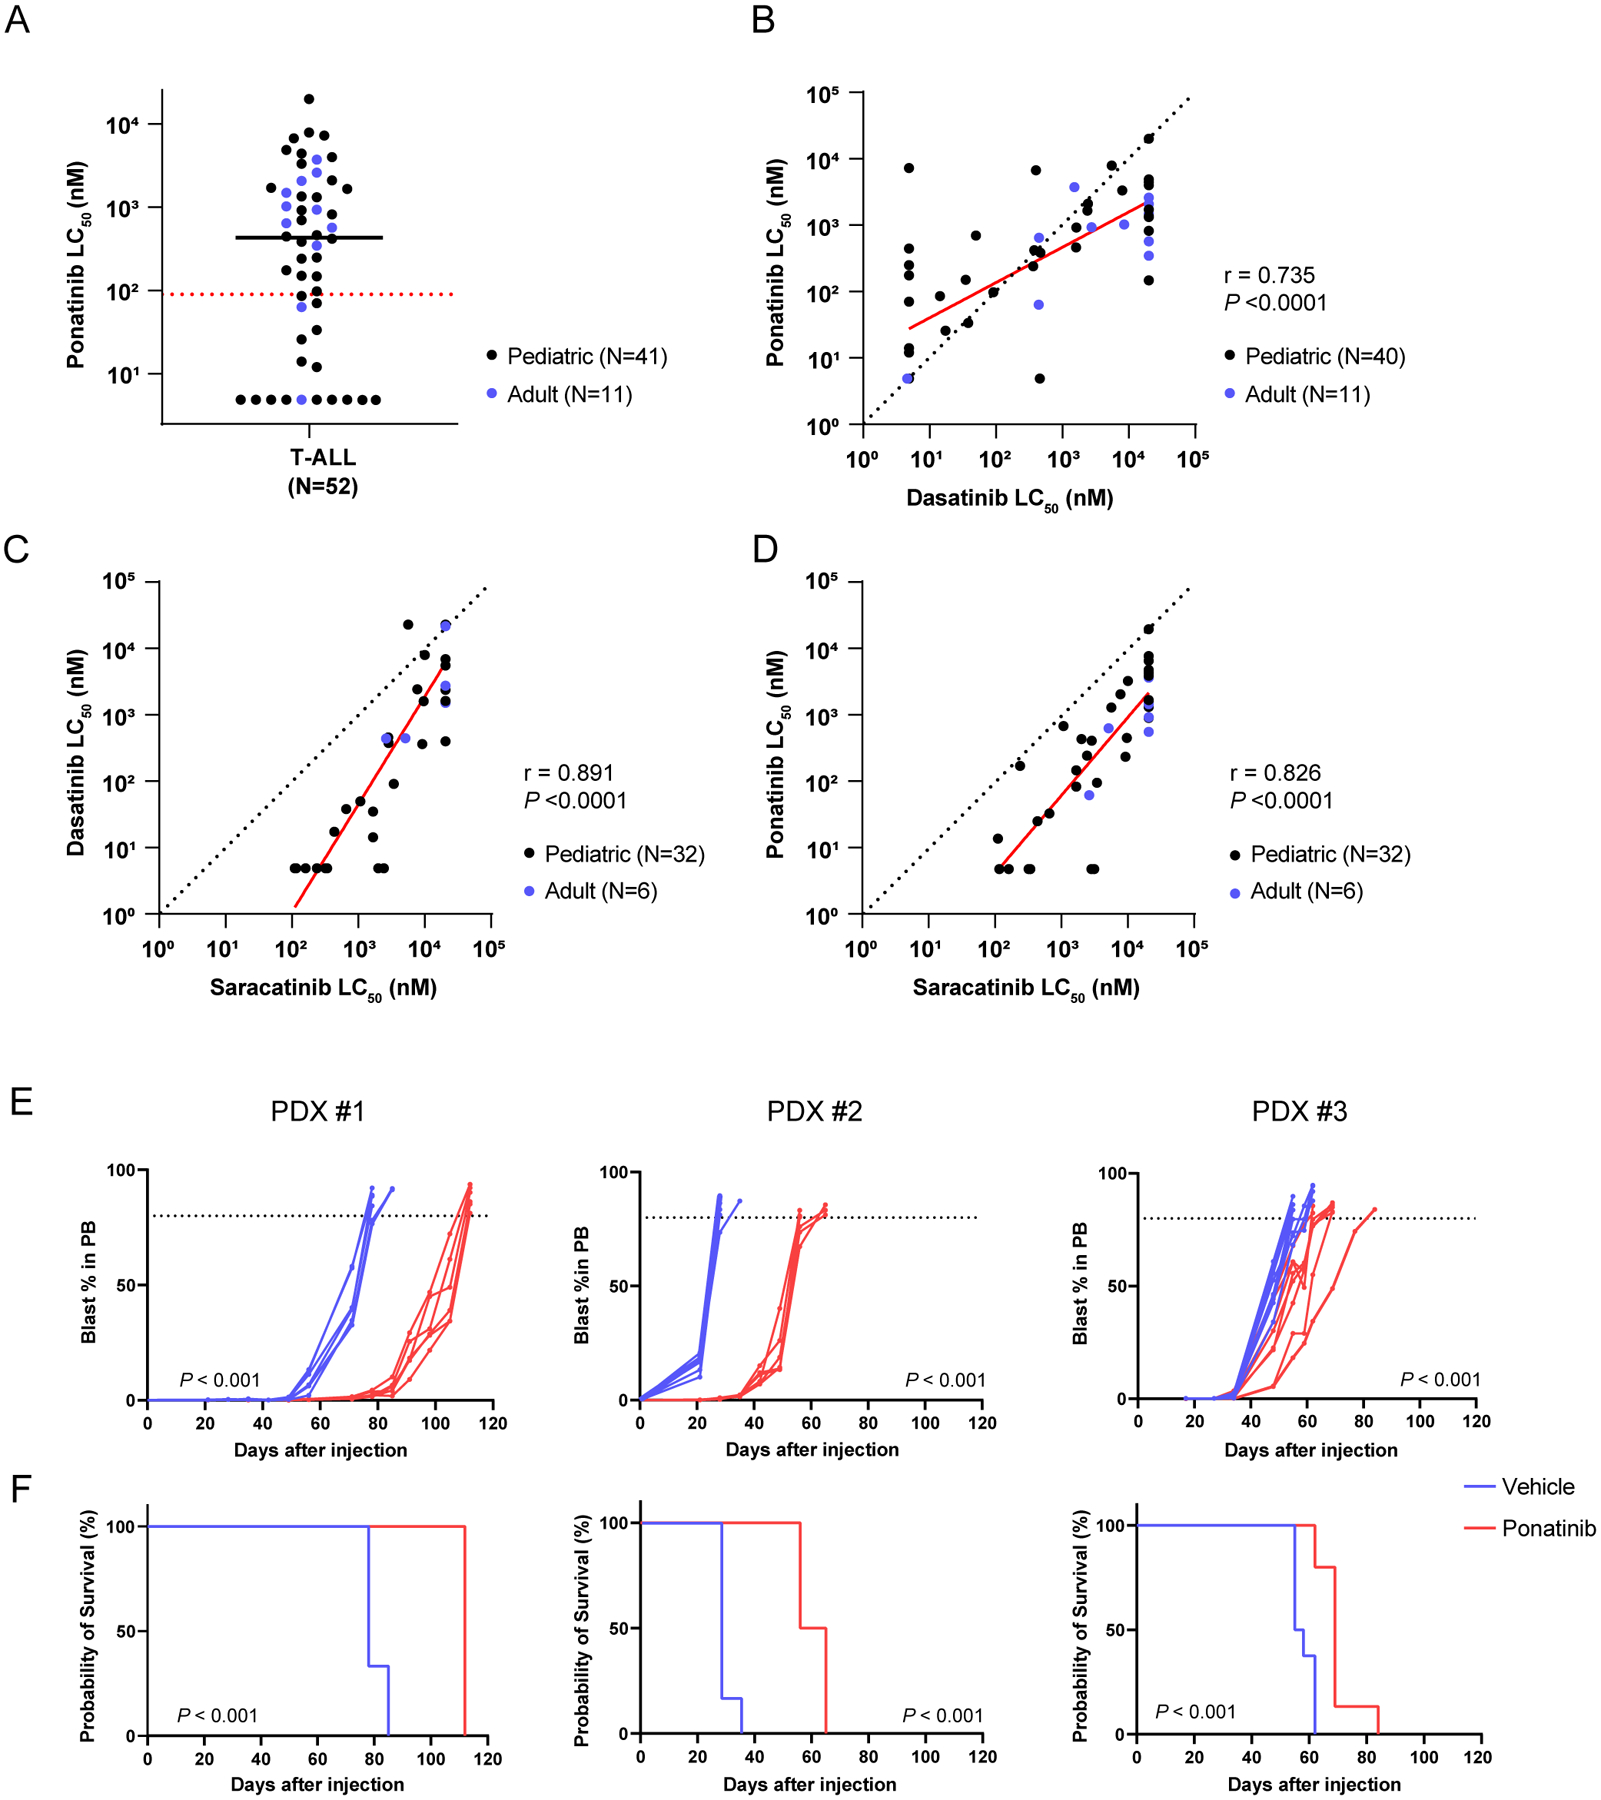
Figure 1. Ponatinib shows antileukemic activity in LCK-activated T-ALL ex vivo and in vivo.

A, Ponatinib LC50 distribution in human T-ALL (N=52). The black solid line and red dash line indicate the median LC50 and the cut-off (90nM) for ponatinib sensitivity, respectively. B-D, Comparison of LC50 between dasatinib and ponatinib (B, N=51), saracatinib and dasatinib (C, N=38), and saracatinib and ponatinib (D, N=38) in T-ALL samples evaluated by Pearson tests. In each panel, the red line indicates the regression line (R2=0.540, P <0.0001 in B; R2=0.793, P <0.0001 in C; R2=0.682, P <0.0001 in D) and the black dashed line represents the line of identity. E, F, In vivo efficacy of ponatinib therapy in three LCK-activated T-ALL PDX models. Leukemic burden of the mice treated with either ponatinib 30 mg/kg or vehicle were monitored by blast % in peripheral blood. Each curve represents an individual mouse and P-value was estimated using a Wilcoxon matched-pairs signed rank test (E). Survival after the injection was estimated for each T-ALL PDX model. P-value was calculated using a log-rank test (F). The ponatinib treatment arms are shown in red, while the vehicle treatment arms are in blue. Each treatment arm included six mice for PDXs #1 and #2, and eight mice per arm for PDX #3 (left, middle, and right panels, respectively). PB, peripheral blood.
