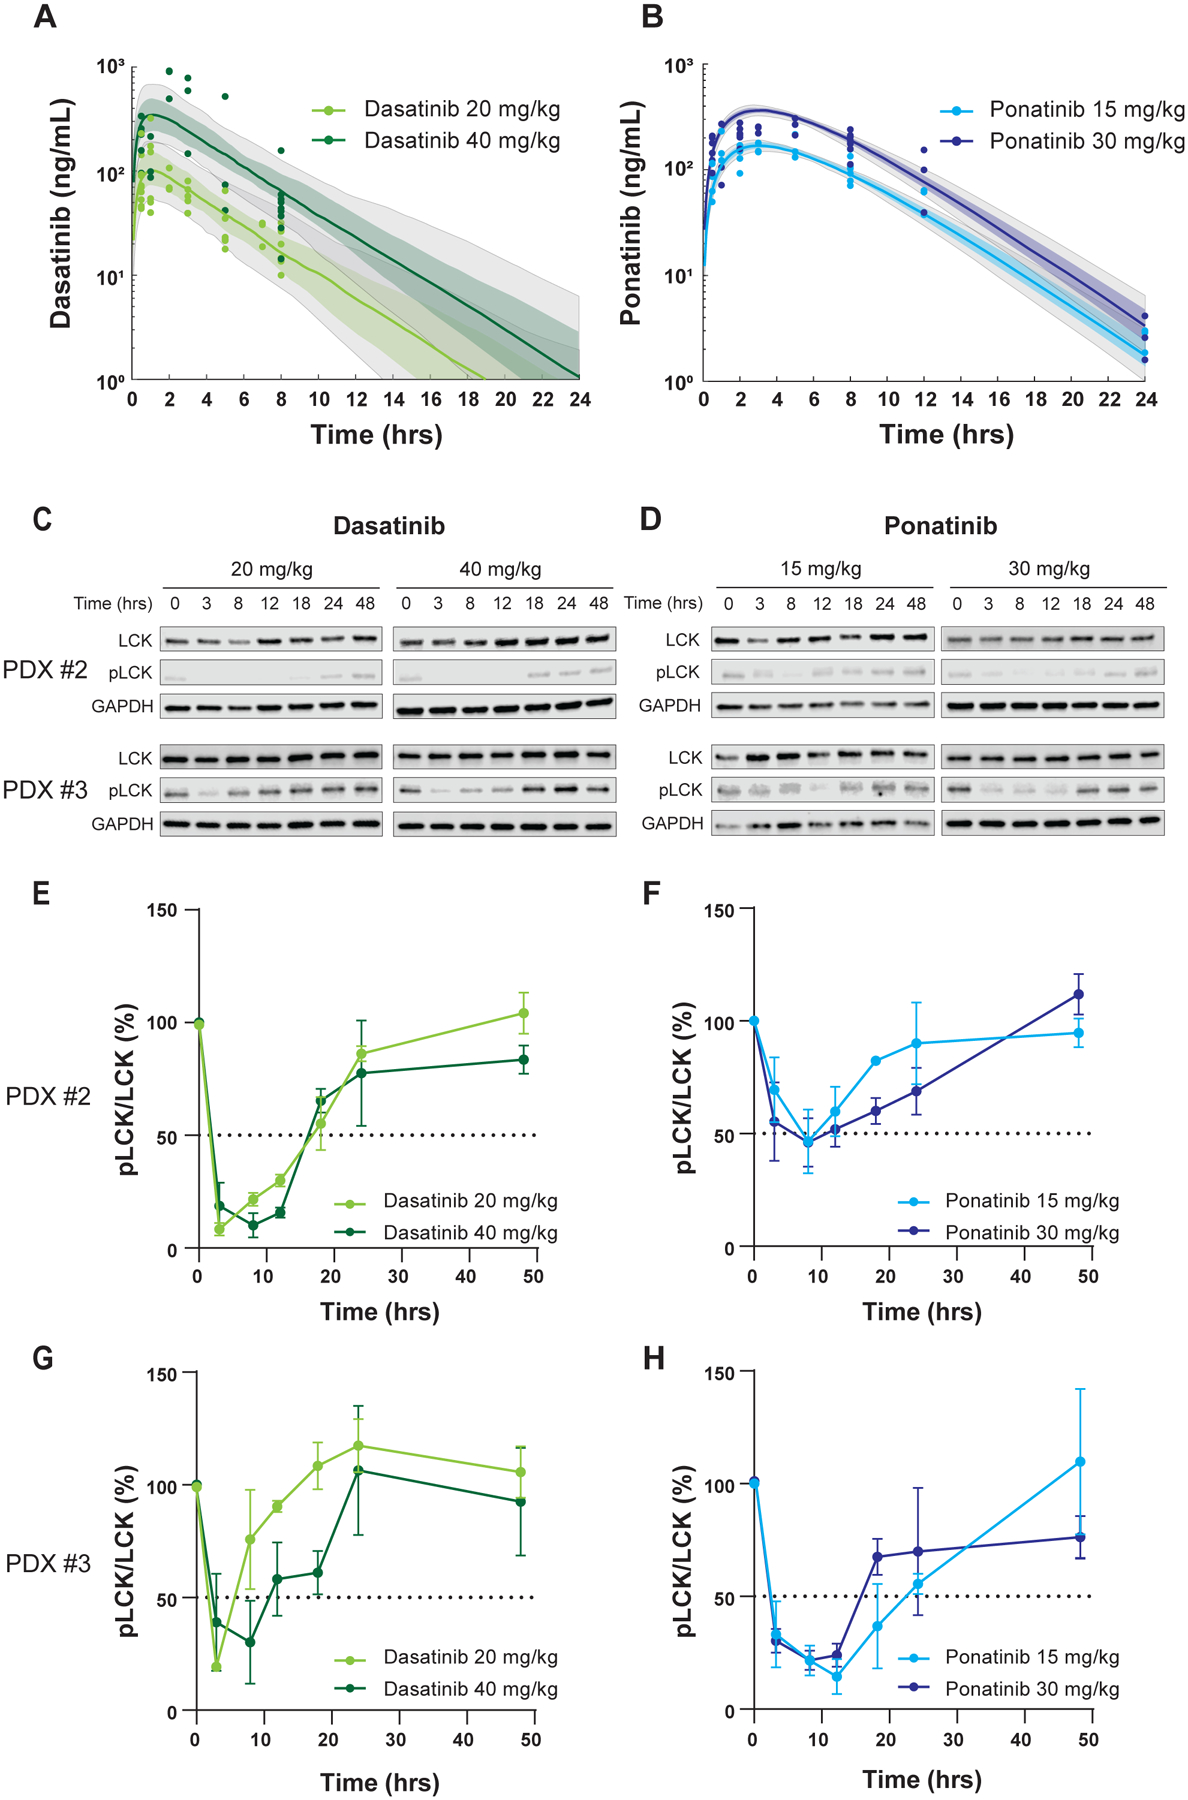
Figure 2. PK and PD profiles of dasatinib and ponatinib in mice.

A, B, Time-dependent change in plasma drug concentration after single dose administered orally. For dasatinib, observed plasma concentrations are plotted in light green (20 mg/kg) and dark green (40 mg/kg) (A), while those are shown in light blue (15 mg/kg) and dark blue (30 mg/kg) for ponatinib (B). The corresponding curves and shaded regions are the median and 25th-75th percentile drug concentrations predicted by a one-compartment PK model with first-order absorption and linear elimination. The grey shaded regions are the 10th-90th percentile model predicted drug concentrations. 100 ng/ml is equivalent to 204.9nM for dasatinib, and 187.8nM for ponatinib. C, D, LCK phosphorylation over time after dasatinib and ponatinib treatment was used as the PD endpoint in the two T-ALL PDX models. pLCK was quantified by Western blotting using near-infrared fluorescence detection. Human T-ALL blasts were collected from mouse bone marrow (derived from PDXs #2 and #3 in Fig. 1E, F) at various time points after a single dose of each drug. Representative results are shown. E-H, The y axes indicate relative phosphorylation levels normalized to mice not receiving drug (0 hr). Each plot is a mean from three mice shown with S.D. as an error bar.
