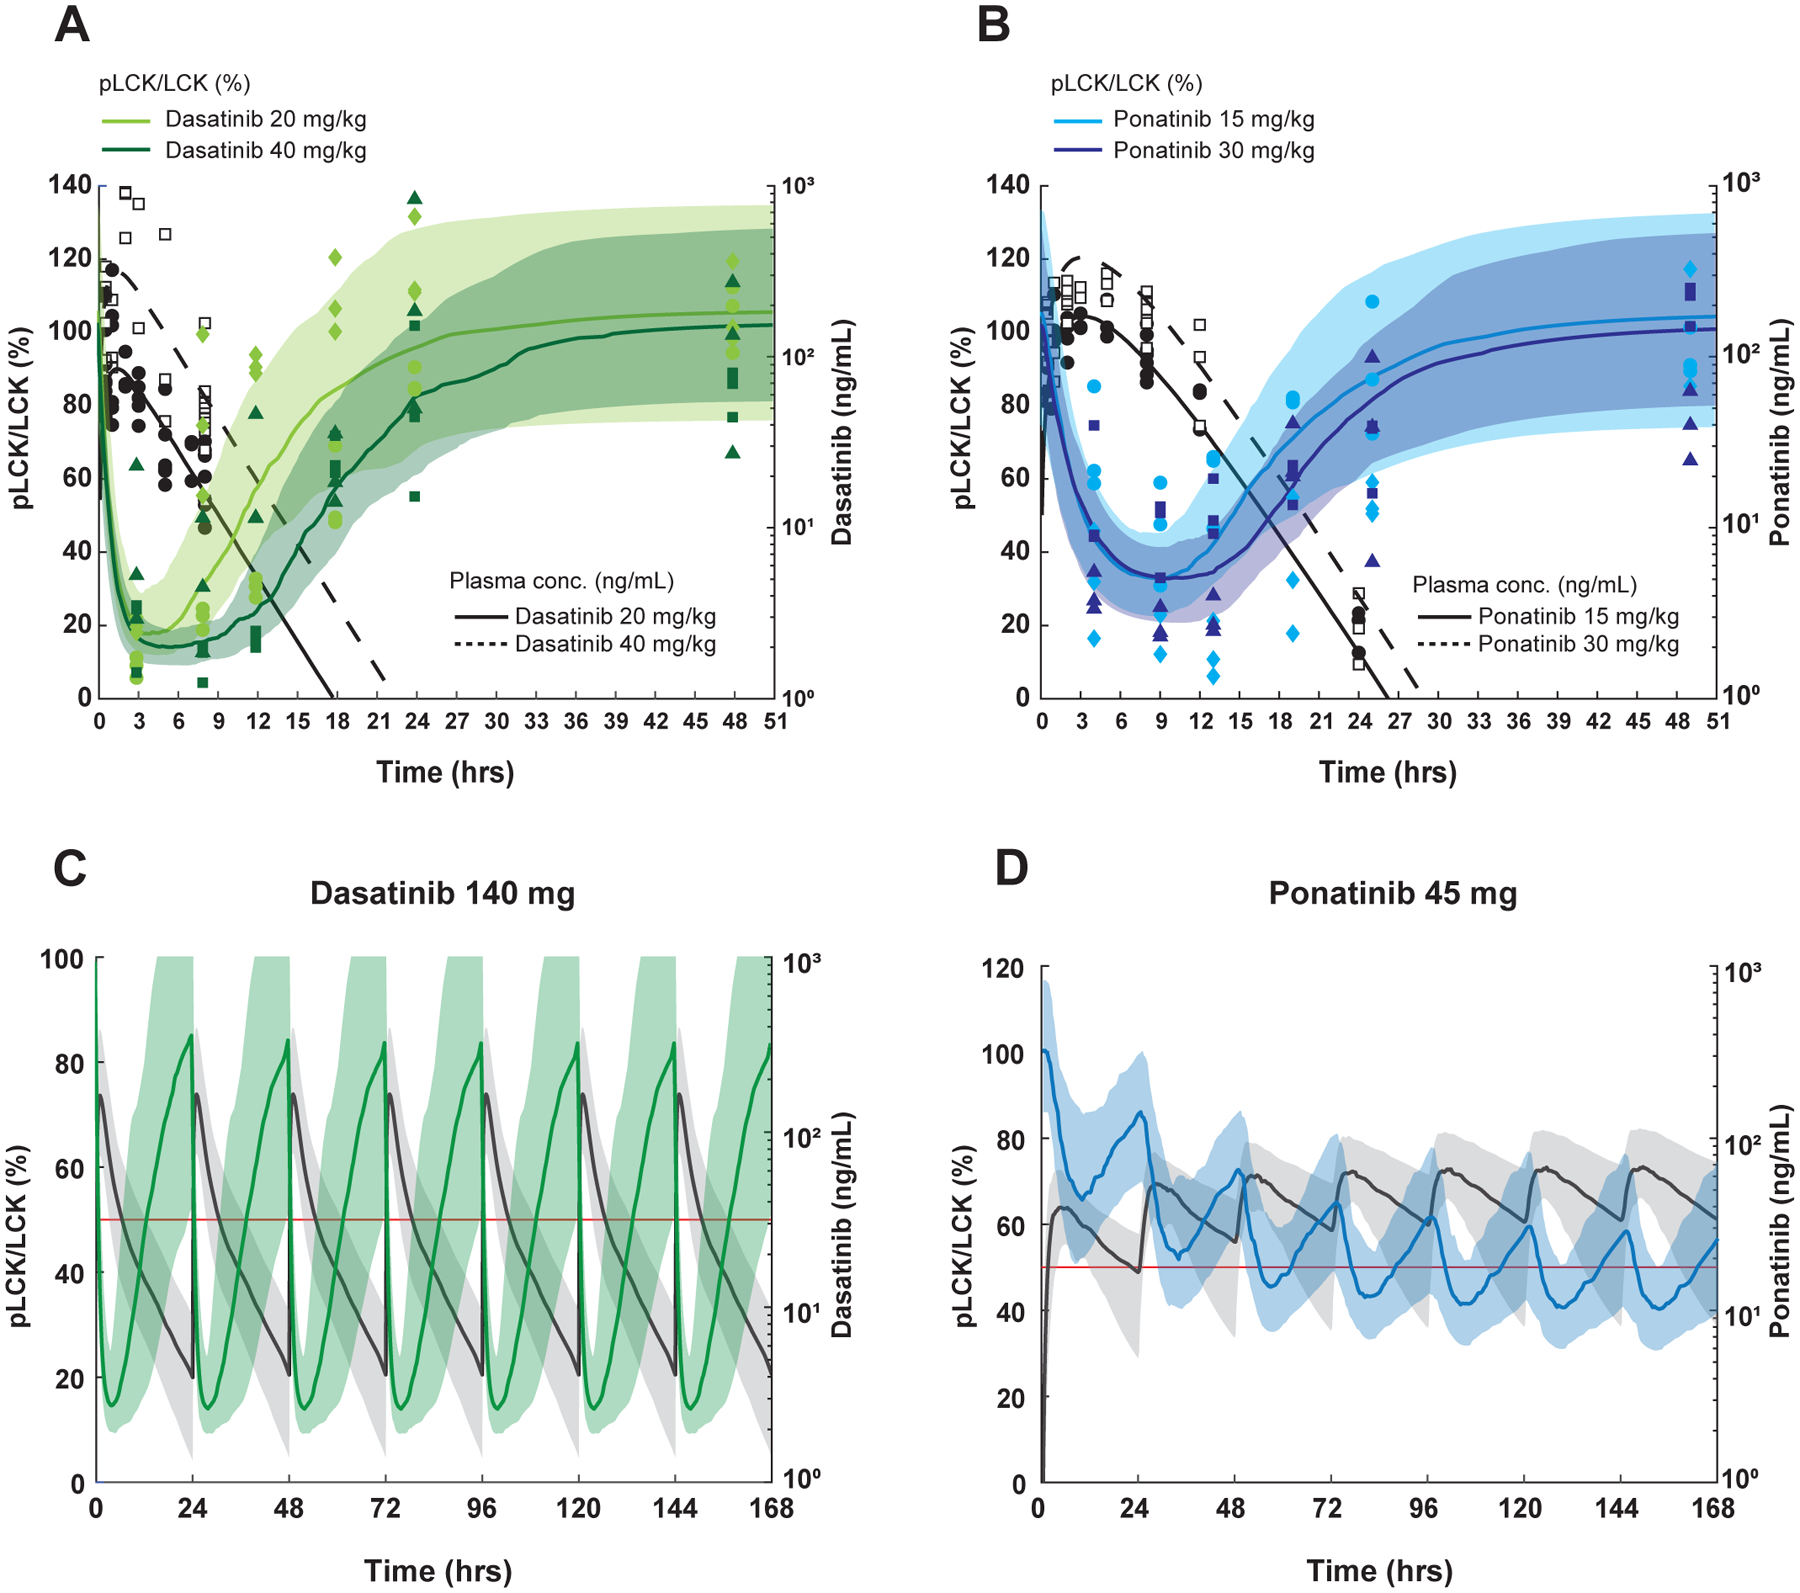
Figure 3. Simulation of PK-PD after repetitive dasatinib and ponatinib dosing in human T-ALL.

A, B, PK/PD modeling in mice after receiving a single dose of dasatinib (A) or ponatinib (B). For pLCK inhibition (left y axis, normalized to untreated animals), data are plotted as light green (20 mg/kg) and dark green symbols for dasatinib (40 mg/kg), while they are plotted as light blue (15 mg/kg) and dark blue symbols (30 mg/kg) for ponatinib Data from PDX #2 are shown as circles and squares, and those from PDX #3 are in rhombi and triangles. The median, 10th-90th percentile pLCK levels were predicted and are respectively shown in the curves and shaded regions in the same colors. For plasma drug concentrations (right y axis) The black circles (lower doses) and black squares (higher doses) show measured plasma drug concentrations and the black solid (lower doses) and black dashed (higher dose) curves indicate the median model estimated drug concentrations. 100 ng/ml is equivalent to 204.9nM for dasatinib, and 187.8nM for ponatinib. C, D, PK and PD simulations at FDA-approved dosages of dasatinib and ponatinib in humans. The steady-state after seven doses of dasatinib 140 mg (C) and ponatinib 45 mg (D) given daily are simulated (N=100). In the dasatinib simulation, the median, and 10th-90th percentile model estimated pLCK levels are shown by the green curve and shaded regions, respectively. For ponatinib, the blue curve and shaded regions indicate the median, 10th-90th percentile model estimated pLCK levels. In both simulations, the black solid curve and shaded regions indicate the median, 10th-90th percentile model estimated drug concentrations. The right y axes, plasma drug concentrations; the left y axes, pLCK levels normalized to the untreated mice. The red lines indicate model estimated pLCK levels equal to 50%.
