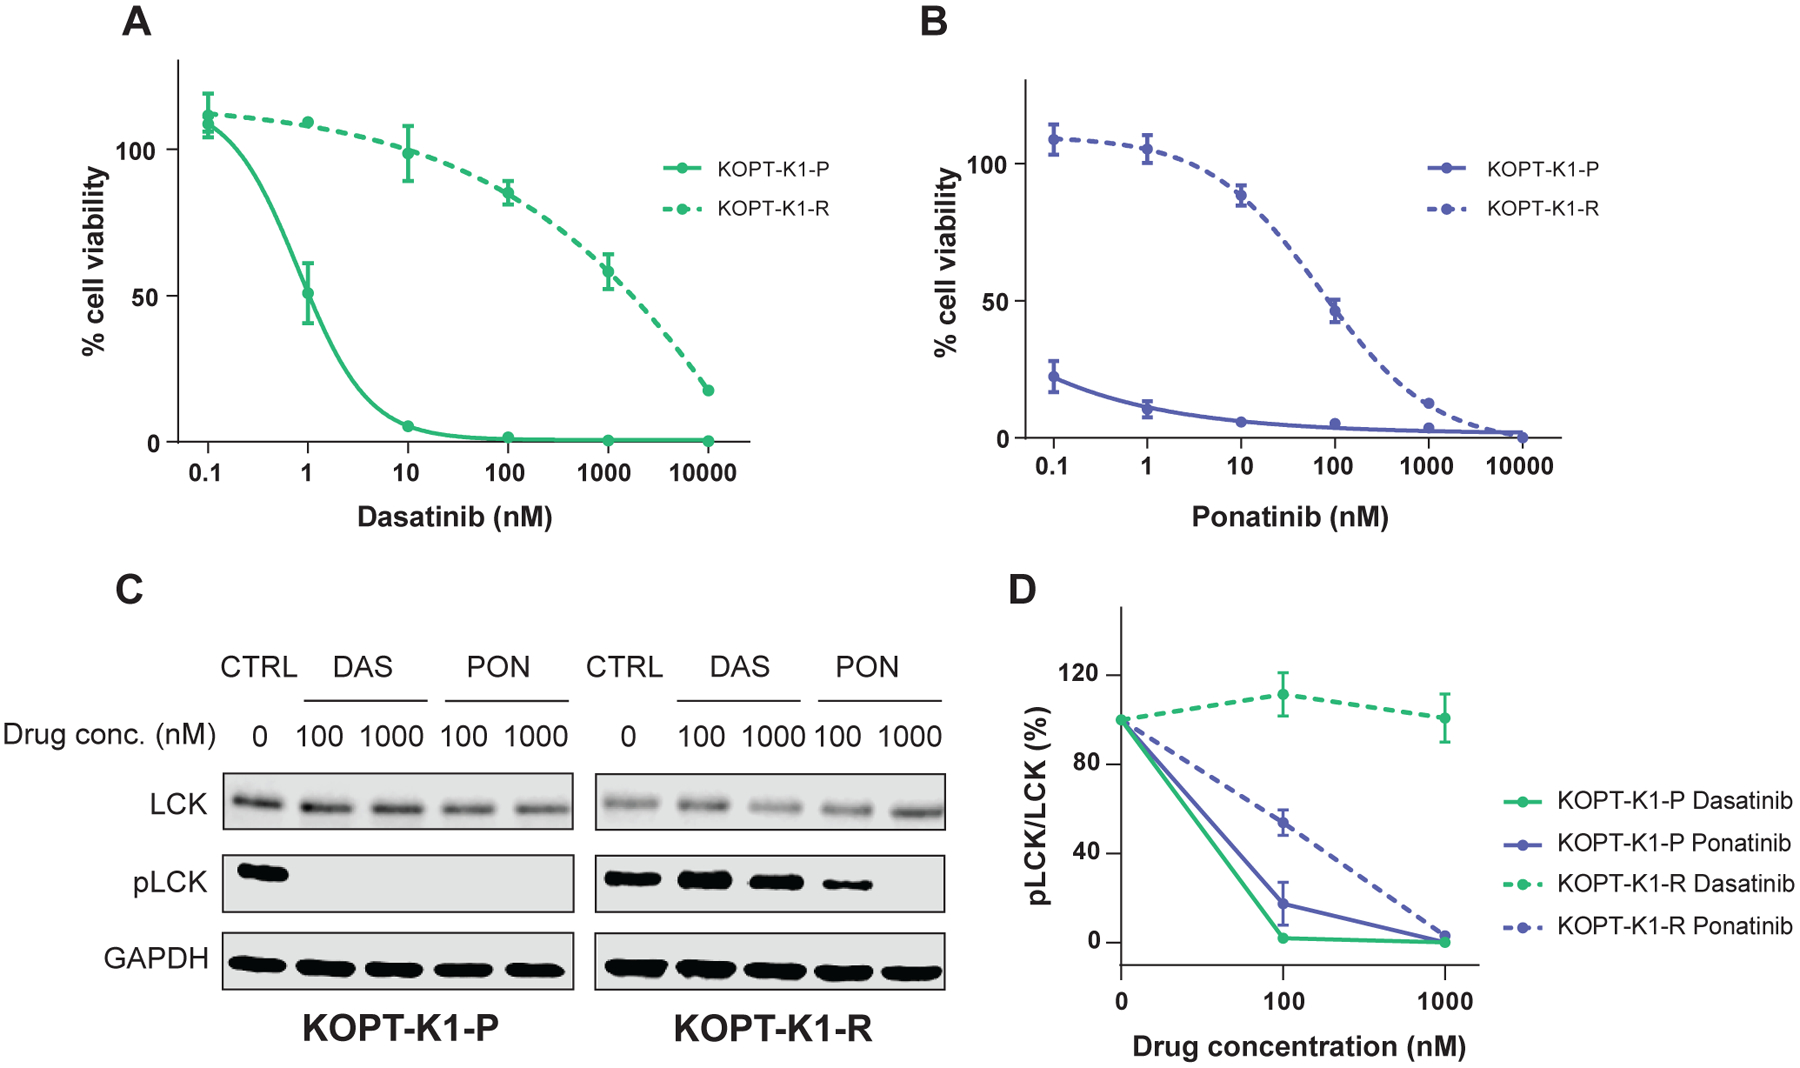
Figure 4. Dasatinib-resistant KOPT-K1 retains its sensitivity to ponatinib.

A, B, The resistant cells (KOPT-K1-R, dashed line) as well as parental cells (KOPT-K1-P, solid line) were subject to either dasatinib (A) or ponatinib (B) treatment for 72 hrs at various concentrations, followed by a CTG assay to evaluate cell viability. The y axes indicate % cell viability compared to the respective untreated cells. C, D, LCK phosphorylation in dasatinib- or ponatinib-treated cells were quantified by Western blotting. The cells were treated at indicated concentrations for 3 hrs. The experiments were repeated three times and a representative image is shown (C). CTRL, no-treatment control; DAS, dasatinib; PON, ponatinib. D, The y axes indicate relative LCK phosphorylation normalized to the level in untreated cells. Each plot is a mean from independent experiments (N=3) shown with S.D. as an error bar.
