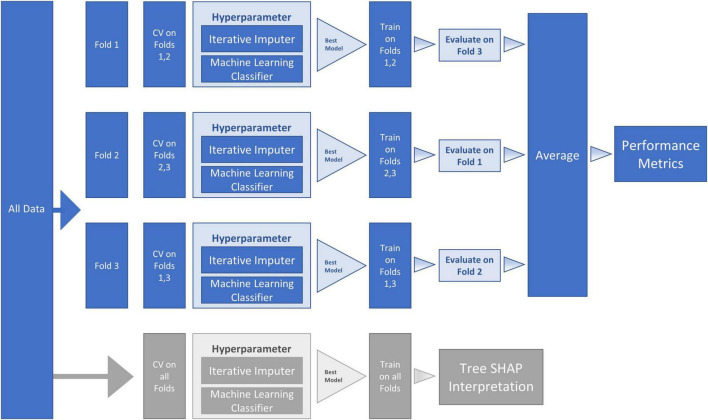
FIGURE 2.
Machine Learning (ML) Pipeline for Random Forest (RF) classifier model and SHapley Additive exPlanation (SHAP) model. The workflow proceeds within the ML pipeline with internal (columns four and five) and external (columns six and seven) cross-validation (CV). As represented in the second and third columns, the dataset was sequentially divided into three folds—with each fold being used for testing one time, thus producing three CV analyses. Two sequential steps were conducted at each of the three fold splits (a) missing data imputation and (b) hyperparameter tuning. The hyperparameter boxes represent tuning that was conducted by performing internal CV on the training folds to find the best model (the model with the highest Area Under the Curve [AUC]). The best model (with selected hyperparameters) was then fitted on the training folds and evaluated on the testing fold. The average of the three fold splits (column eight) was used to estimate the performance metrics of the final tuned model fitted on all the data. To reduce variance due to the small sample size, this procedure was repeated 10 times and averaged to obtain final performance metrics (column nine). The lower row in the figure (in gray) represents the SHAP steps used for model interpretation. Specifically, we used TreeExplainer to approximate the original model and calculate Tree SHAP values that were used for the interpretation plots.

