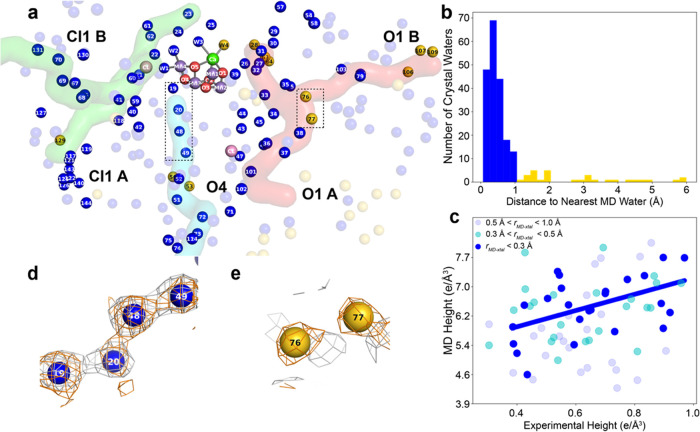
Figure 3.
Comparing the MD-derived electron density for waters with the crystallographic electron density. (a) Crystallographically modeled waters around the OEC, color-coded by their relative agreement to the MD density. Blue-colored waters are less than 1.0 Å from a peak in the simulated electron density map, while gold-colored waters are more than 1.0 Å away from the nearest simulated peak. The three water channels of interest: The O1 channel (red), Cl channel (green), and O4 channel (blue) are also overlaid. (b) Distribution of distances between crystallographic water positions and MD water density peaks within a 25 Å radius from the OEC (centered on O1). (c) Scatterplot showing the correlation between the MD and experimental electron density peak heights for different groups of MD waters in the inner (blue), middle (cyan), or outer (light blue) shell. (d) Example of a region with close MD water peaks and corresponding crystallographic waters. The simulated MD water density (gray contour at 2.08 e/Å3) is shown in the context of the crystallographic waters (numbered blue spheres). The experimental 2Fo-Fc map is overlaid (orange) and contoured at 1σ. (e) Example of a region with distant MD water peaks and corresponding crystallographic waters. The simulated MD water density (gray and contoured at 2.08 e/Å3) is shown in the context of the crystallographic waters (numbered yellow spheres). Experimental 2Fo–Fc map is overlaid (orange) and contoured at 1σ. The water numbering convention for all waters in the vicinity of the OEC has been described previously.8 The numbers of waters are based on the 0F (S1 state) experimental crystal structure used by Hussein et al.8 (PDB ID Code 7RF2). The channels were mapped by Caver 3.0 Pymol plugin using this room-temperature crystal structure.57,58

