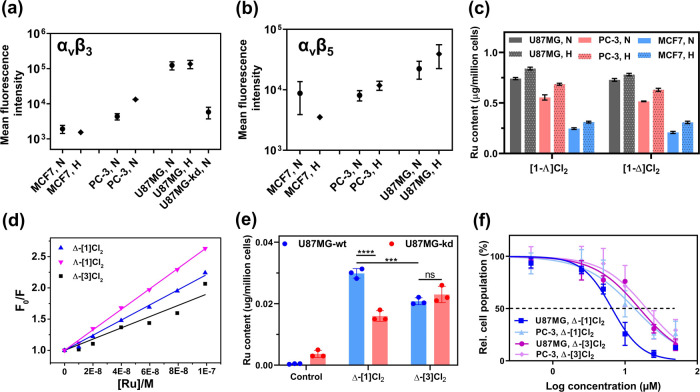
Figure 5.
Receptor-mediated cell uptake. The expression of aVβ3 (a) and aVβ5 (b) integrin in U87MG, PC-3, MCF7, and ITGAV knockdown U87MG cell lines. Cell groups (N: normoxia, H: hypoxia) represent the fluorescence intensity of the cells incubated with either anti-integrin αVβ3 or αVβ5 monoclonal antibodies, followed by a secondary antibody conjugated to Alexa-Fluor 488. Error represents the standard deviation (SD) from duplicate experiments. The representative flow cytometry histogram can be found in Figures S29 and S30. (c) Intracellular Ru content (μg/million cells) of U87MG, PC-3, or MCF7 cells after exposure to complexes Λ-[1]Cl2 or Δ-[1]Cl2 (12.5 μM, dark, 6 h) in normoxia (N, 21% O2) or hypoxia (H, 1% O2). Error represents the standard error of the mean (SEM) from triplicate wells. (d) Fitting curve of the Stern–Volmer plots (F0/F vs [Ru]) for the quenching of the emission of integrin αIIbβ3 titrated with complexes Λ-[1]Cl2, Δ-[1]Cl2, and Δ-[3]Cl2 (see raw data in Figure S31). (e) Intracellular Ru content (μg/million cells) of wild-type U87MG (U87MG-wt) and ITGAV knockdown U87MG (U87MG-kd) cells after exposure to complexes Δ-[1]Cl2 or Δ-[3]Cl2 (10 μM, dark, 2 h) in normoxia. Error represents SD, n = 3. (f) Dose–response curves for U87MG and PC-3 cell lines incubated with Δ-[1]Cl2 or Δ-[3]Cl2 for 6 h, washed with fresh medium, and irradiated with green light (520 nm, 13.1 J/cm2). Response curves in the dark can be found in Figure S33; error bars represent 95% confidence intervals, n = 3.

